In the very first advent calendar blog post this year, I’ve shown you how to “Getting started with JavaScript debugging“. Today, I want to show some more advanced techniques you can use to debug your code.
Different logging types
In the first blog post, we have only used console.log(), but there are more functions from the console object you can use:
console.debug('debug message');
console.info('info message');
console.log('log message');
console.error('error message');
console.warn('warn message');
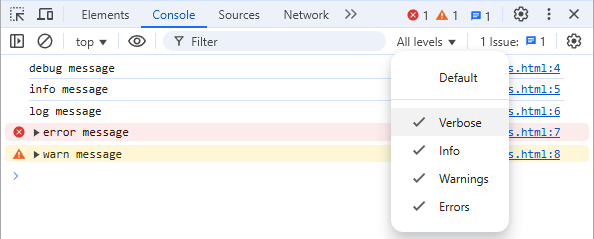
And this is how they would look like in the Chrome Console:

The info and log method produce a similar output. The error and warning however are styled more prominent. Some of you might have noticed, that we only see 4 lines here. Where is the debug logging? This one might not be shown (by default) in your browser. In Chrome, you would click on the “Default levels” dropdown. Here, you can also activate “Verbose” to see the debug messages:

Since the debug output is also similar (in Chrome), you might not really need it. I would probably mainly use log, warning and error.
Using format strings and styling in messages
The debugging function accepts more than one parameter. If you just ass multiple strings, numbers, objects, etc., it would print each of them in one line separated by a space (for scalar types) or in multiple lines (for objects). But you can also use additional parameters for format strings and even styling.
Let’s begin with a format string. An example with a single %s placeholder for a string might look like this:
const code = 'Code';
console.log('%s is Poetry.', code);
And the output would be Code is poetry, as we would expect. But apart from the usual format string placeholder, you can use the %c placeholder. The very next parameter would be a CSS string, the following text would be styles with. Just like this:
console.log(
	'This is %csome green text, followed by %csome red and italic text.',
	'color: green;',
	'color: red; font-style: italic;',
);
If you have multiple %c placeholders, the styles our change to the next parameter and style any following text with these new styles. The output from the code above looks like this:

You can also combine the %c placeholders with any other usual placeholder. Why don’t you give it a try in your current browser console? But you can’t go too crazy. There are also a few CSS properties and values you can use in Firefox and Chrome.
More useful console debugging function
If you log a lot of messages, you can group them. You would start a new group by calling the console.group() function (with an optional label) and close the group with console.groupEnd(). You can even nest groups in groups, creating something like a “tree structure”.
There are some other instance methods you mind find useful in your debugging task, but one of them is really cool!
Measuring times in the console
The console object has some timing functions you can use for some easy performance checks. Here is an example using the console.time() function:
console.time("a timer label");
slowFunction(1000);
console.timeEnd("a timer label");

function slowFunction(milliseconds) {
	const start = Date.now();
	while (Date.now() - start < milliseconds) {
		// Simulating a long-running function
	}
}
The function “waits for one second” inside the while loop. The output in Chrome looks like this:
a timer label: 999.2578125 ms
Using the optional “label” as the first parameter, you can have multiple timers running. If you want to measure times in between, you can use console.timeLog() (with your label) to get “split times”.
Conclusion
While developing or analyzing some code, it can really help to log things to the browser console. If you have only used console.log() so far, make yourself familiar with the other useful methods.
But when it comes to finalizing your code, always make sure to remove those debugging methods. Some JavaScript compilers might even do that automatically, when you “build for production”.