In the previous blog posts, I have shown you how to add a marker for a GPS coordinate to an SVG image. In this case, we calculated the x/y pixel position and have drawn an SVG circle or marker path. But what can we do if we have a satellite image – or any other pixel graphic?
Solution: use an SVG as well 😉
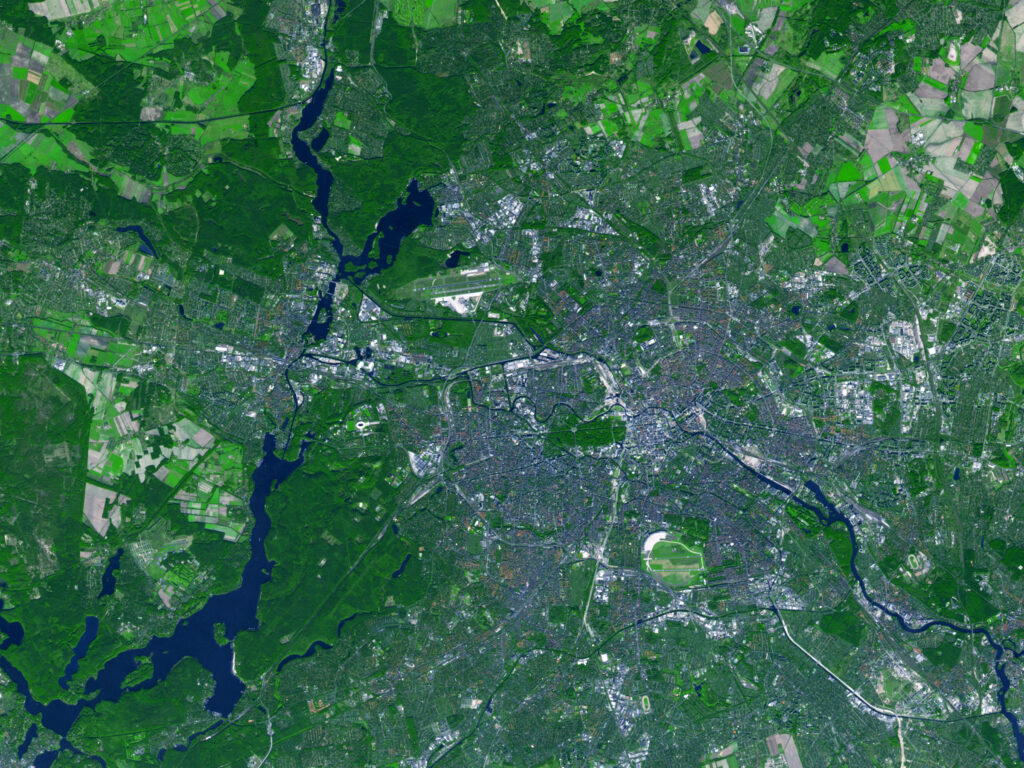
OK, not just any SVG. The technique we are using here could be called “a modern image map”. Those of you who are building websites a bit longer probably still know the <map> element which could be used to make an <area> of an <img> tag clickable. The shapes for such an image map however were quite limited and not as flexible and precise as SVG paths. So instead of using a traditional image map, we use an (empty) SVG and place it over an image to create a “clickable map”. Well, we actually just create a clickable SVG overlay, but this will get us the result we want to have. For this blog post, we are using the following satellite image of Berlin:
Getting the image boundaries
As explained in the previous blog post, we need to define the boundaries of the map we want to add markers to. We start again by defining the boundaries of the image itself, which is the pixel size:
// Init PixelGeocoder using WGS84 and Mercato projection.
$pixel_geocoder = new PixelGeocoder( 'EPSG:4326', 'EPSG:3857' );
// Set boundaries for the map.
$pixel_geocoder->image_boundaries = [
	'xmin' => 0,
	'xmax' => 2400,
	'ymin' => 0,
	'ymax' => 1800,
];
Now we need the GPS boundaries. For this image, we don’t have them. In order to get them, I searched for spots on the edge of the map I could identify on Google Maps and then got their position. These are the ones I have chosen and added as reference points:
$map_edges = [
	[ 13.0467623, 52.5594922 ], // West.
	[ 13.1993623, 52.6484712 ], // North.
	[ 13.5841963, 52.4416892 ], // East.
	[ 13.2766553, 52.4069153 ], // South.
];

$pixel_geocoder->setDstBoundaries(
	$map_edges,
	false,
	true
);
Now that we have the boundaries, we can calculate the coordinates for the Brandenburg Gate again:
// Calculate the coordinates.
$bb_gate_lat     = 13.3777041;
$bb_gate_lng     = 52.5162746;
$bb_gate_dst_arr = $pixel_geocoder->transformGPStoMapProjection( $bb_gate_lat, $bb_gate_lng );
$bb_gate_coords  = $pixel_geocoder->calculateCoordinatesToPixel( $bb_gate_dst_arr[0], $bb_gate_dst_arr[1] );

var_dump( bb_gate_coords );
/**
 * array(2) {
 *   [0]=>
 *   float(1477.8750879177708)
 *   [1]=>
 *   float(986.3143837577029)
 * }
 */
But how do we now get a marker as an overlay of the satellite image? This is where the SVG image map comes into play.
Generate the SVG image map
An SVG image map is just an empty “SVG canvas” you would place things. We define a single SVG tag with the same width and height as our satellite image. The image itself would just be a sibling node. We wrap both in a container element to add some styles:
<div class="image-map">
	<img class="image-map-background" src="./Berlin-Germany-Flickr-NASA-Goddard-Photo-and-Video1.jpg" alt="Berlin NASA image"/>
	<svg xmlns="http://www.w3.org/2000/svg" xmlns:xlink="http://www.w3.org/1999/xlink" class="dynamic-map" width="2400" height="1800" viewBox="0 0 2400 1800"></svg>
</div>
To place the SVG over the image, we define a fixed with and height for the container element (this should have the same “aspect ratio” as the image):
.image-map {
	position: relative;
	width: 600px;
	height: 450px;
}

.image-map-background,
.dynamic-map {
	max-width: 100%;
	height: auto;
}

.dynamic-map {
	position: absolute;
	top: 0;
	left: 0;
}
Now we can add our markers. I would usually do that by getting a list of the markers either from a static array or using a WP_Query and some meta fields. Let’s take this static array with our single marker as an example:
$markers = [
	[
		'name'  => 'brandenburg-gate',
		'title' => 'Brandenburg Gate',
		'x'	 => $bb_gate_coords[0],
		'y'	 => $bb_gate_coords[1],
		'url'   => 'https://en.wikipedia.org/wiki/Brandenburg_Gate',
	]
];
As we are about to print the marker with some SVG paths and links, we can make this easier to read by using a marker template:
$marker_markup = '
	<a xlink:title="%1$s" target="_parent" class="marker" id="%2$s" xlink:href="/%3$s/" transform="translate(%4$s,%5$s)">
		<path fill="#c10926" fill-rule="evenodd" d="m -0.266,-28.261 a 4.504,4.504 0 0 0 3.204,-1.343 4.613,4.613 0 0 0 1.327,-3.242 4.615,4.615 0 0 0 -1.327,-3.244 4.508,4.508 0 0 0 -3.204,-1.343 4.512,4.512 0 0 0 -3.206,1.343 4.619,4.619 0 0 0 -1.327,3.244 c 0,1.215 0.478,2.382 1.327,3.242 a 4.51,4.51 0 0 0 3.206,1.343 m -0.613,27.98 -8.895,-28.49 h 0.013 a 10.555,10.555 0 0 1 -0.818,-4.074 c 0,-2.77 1.086,-5.425 3.02,-7.381 a 10.251,10.251 0 0 1 7.294,-3.056 c 2.735,0 5.358,1.099 7.293,3.056 a 10.502,10.502 0 0 1 3.021,7.38 c 0,1.414 -0.284,2.798 -0.819,4.076 h 0.012 z" clip-rule="evenodd"/>
	</a>';
Now we put it all together inside our SVG in a loop:
<svg xmlns="http://www.w3.org/2000/svg" xmlns:xlink="http://www.w3.org/1999/xlink" class="dynamic-map" width="2400" height="1800" viewBox="0 0 2400 1800">
	<?php foreach ( $markers as $marker ) : ?>
		<?php
		printf(
			$marker_markup,
			$marker['title'],
			$marker['name'],
			$marker['url'],
			$marker['x'],
			$marker['y']
		);
		?>
	<?php endforeach; ?>
</svg>
By using the printf() function, we can put the dynamic parts into the marker template. When you are using this in WordPress, make sure to use the esc_*() escape functions for the dynamic values.
I used the same approach to visualize the “map edges” as a cyan colored circle. The final result will look like this (it’s just a screenshot of the result):
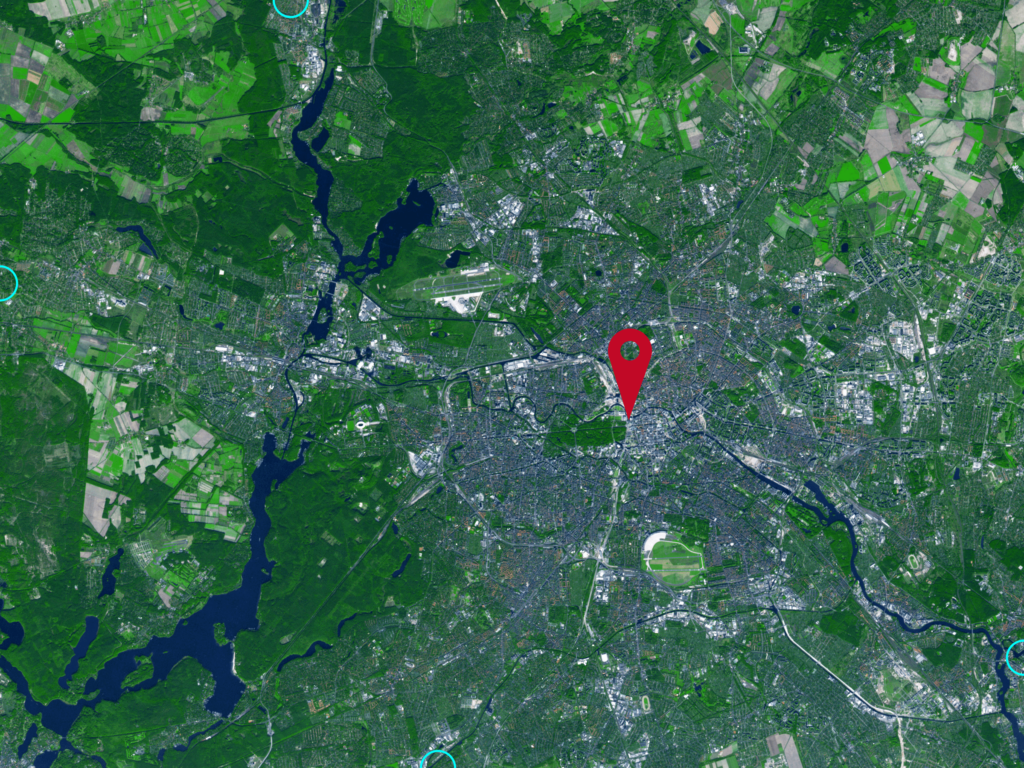
As the marker we have used is pretty small, I have just scaled it up. As the maker scales by its point, this can be done with a single CSS definition:
.marker path {
	transform: scale(5);
}
Conclusion
In a very similar way, we were able to create an SVG image map with some clickable markers on a satellite image. For the image of a city, this can probably be done if any satellite image. For larger regions, you need to find images with the Mercator projection (or any other projection supported by the PROJ library). It took me quite a while to find a CC licensed image for my examples of this blog post.
If you want this code as well, you can find the new branch with all the different parts combined in a new PHP file on GitHub. You will also find the satellite images there.
I hope this showed you another nice way to use an SVG for an individual map. But we have used quite a bit of custom PHP code and an external library to achieve it. In the next (and probably final) blog post of this map series, I will introduce you with a library you might have already used, just not in this way. So gain, stay tuned. The year will end, but calendar week 52 has one more day in 2023! ?