In the last two blog posts, we have written some PHP code for geocoding. This week, I want to show you how to do something similar with Leaflet, a well-known JavaScript library you can use to create maps. As it also has the feature to add a custom image layer, we will use it to create a map again.
Getting started with Leaftlet
When using Leaflet, you first have to include some (external) CSS and JavaScript. You can find more details in the quick start guide, but you will basically need the following:
 <link rel="stylesheet" href="https://unpkg.com/[email protected]/dist/leaflet.css"
     integrity="sha256-kLaT2GOSpHechhsozzB+flnD+zUyjE2LlfWPgU04xyI="
     crossorigin=""/>

 <script src="https://unpkg.com/[email protected]/dist/leaflet.js"
     integrity="sha256-WBkoXOwTeyKclOHuWtc+i2uENFpDZ9YPdf5Hf+D7ewM="
     crossorigin=""></script>

<div id="leaflet-map"></div>
Besides the CSS and JS, you would need a container that the map is going to use. You also need some basic styles, but we get to them later.
Setting up the map
As with our previous examples, we have used a map of Germany with a specific size and some boundaries. We also have to define them when using Leaflet:
// Create the map object.
const map = L.map( 'leaflet-map', {
    center: [ 51.1642, 10.4541 ],
    maxZoom: 10,
    zoomDelta: 1,
    zoomSnap: 0,
    scrollWheelZoom: false,
    trackResize: true,
    attributionControl: false,
} );

// Define the image overlay and its boundaries.L.marker([52.5162746,13.3777041]).addTo(map);
const imageUrl = './ammap-germany-low.svg';
const imageBounds = [
    [ 55.051693, 5.864765 ],
    [ 47.269299, 15.043380 ],
];

// Add the overlay to the map.
L.imageOverlay( imageUrl, imageBounds ).addTo( map );

// Automatically zoom the map to the boundaries.
map.fitBounds( imageBounds );
We first create a map object with some basic configuration. Then we define the image source and its boundaries in GPS coordinates, before we add it to the map. In the last step, we fit the map into the container.
The container should have a good size to fit the map and its ratio. We just take the SVG image size in our CSS:
#leaflet-map {
    width: 585.506px;
    height: 791.999px;
    background: white;
    max-width: 100%;
    max-height: 100%;
}
It does not have to be this exact, and you can use a container that is larger/smaller than the SVG image as well.
Adding markers to the map
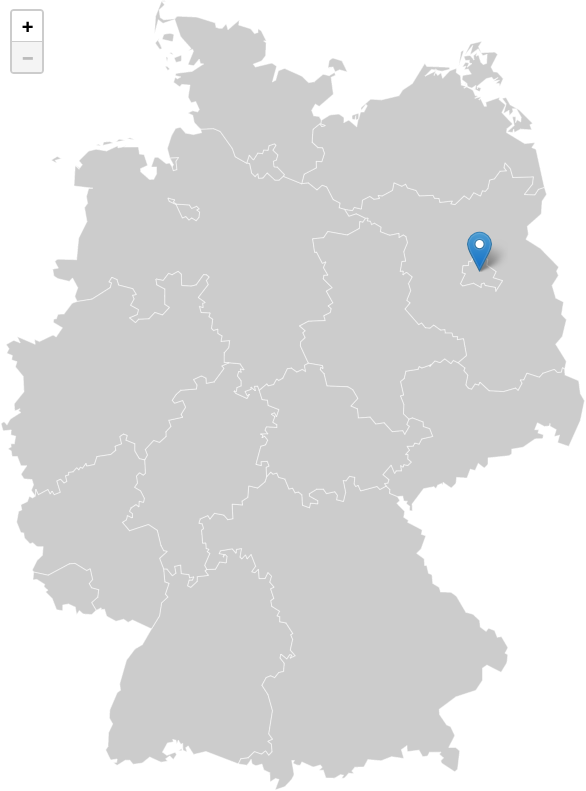
Now that we have the map, who do we add markers to it? Well, since we are using a mapping library, nothing easier than that. For the marker to the Brandenburg Gate, we just need one line:
L.marker([52.5162746,13.3777041]).addTo(map);
That’s really it! No more transformation from GPS to pixel coordinates. This is all done by Leaflet. You will get the following result:
The only downside is that out of the box, Leaflet only supports the EPSG:3857 projection (Web Mercator). If you need a different projection, there is however a PROJ extension: Proj4Leaflet.
Adding the capitals of all Germany states to the map
Since you probably want to display more than one marker, let’s add some more to the map. I’ve made a list of all capitals of the 16 Germany states for this example:
var capitals = [
    {
        'state': 'BB', 'name': 'Potsdam',
        'lat': 52.4009309, 'lng': 13.0591397,
        'url': 'https://de.wikipedia.org/wiki/Potsdam'
    },
    {
        'state': 'BE', 'name': 'Berlin',
        'lat': 52.5170365, 'lng': 13.3888599,
        'url': 'https://de.wikipedia.org/wiki/Berlin'
    },
    {
        'state': 'BW', 'name': 'Stuttgart',
        'lat': 48.7784485, 'lng': 9.1800132,
        'url': 'https://de.wikipedia.org/wiki/Stuttgart'
    },
    {
        'state': 'BY', 'name': 'München',
        'lat': 48.1371079, 'lng': 11.5753822,
        'url': 'https://de.wikipedia.org/wiki/München'
    },
    {
        'state': 'HB', 'name': 'Bremen',
        'lat': 53.0758196, 'lng': 8.8071646,
        'url': 'https://de.wikipedia.org/wiki/Bremen'
    },
    {
        'state': 'HE', 'name': 'Wiesbaden',
        'lat': 50.0820384, 'lng': 8.2416556,
        'url': 'https://de.wikipedia.org/wiki/Wiesbaden'
    },
    {
        'state': 'HH', 'name': 'Hamburg',
        'lat': 53.550341, 'lng': 10.000654,
        'url': 'https://de.wikipedia.org/wiki/Hamburg'
    },
    {
        'state': 'MV', 'name': 'Schwerin',
        'lat': 53.6288297, 'lng': 11.4148038,
        'url': 'https://de.wikipedia.org/wiki/Schwerin'
    },
    {
        'state': 'NI', 'name': 'Hannover',
        'lat': 52.3744779, 'lng': 52.3744779,
        'url': 'https://de.wikipedia.org/wiki/Hannover'
    },
    {
        'state': 'NW', 'name': 'Düsseldorf',
        'lat': 51.2254018, 'lng': 6.7763137,
        'url': 'https://de.wikipedia.org/wiki/Düsseldorf'
    },
    {
        'state': 'RP', 'name': 'Mainz',
        'lat': 50.0012314, 'lng': 8.2762513,
        'url': 'https://de.wikipedia.org/wiki/Mainz'
    },
    {
        'state': 'SH', 'name': 'Kiel',
        'lat': 54.3227085, 'lng': 10.135555,
        'url': 'https://de.wikipedia.org/wiki/Kiel'
    },
    {
        'state': 'SL', 'name': 'Saarbrücken',
        'lat': 49.234362, 'lng': 6.996379,
        'url': 'https://de.wikipedia.org/wiki/Saarbrücken'
    },
    {
        'state': 'SN', 'name': 'Dresden',
        'lat': 51.0493286, 'lng': 13.7381437,
        'url': 'https://de.wikipedia.org/wiki/Dresden'
    },
    {
        'state': 'ST', 'name': 'Magdeburg',
        'lat': 52.1315889, 'lng': 11.6399609,
        'url': 'https://de.wikipedia.org/wiki/Magdeburg'
    },
    {
        'state': 'TH', 'name': 'Erfurt',
        'lat': 50.9777974, 'lng': 11.0287364,
        'url': 'https://de.wikipedia.org/wiki/Erfurt'
    },
];
Similar to the examples in the other two blog posts, we would also like to link the markers to a page. In this case, I just took the German Wikipedia pages for all of them. A marker can get several event handlers. We use the onclick here. Adding all markers from the list can be done with this code:
capitals.map( city => {
    let marker = L.marker( [ city.lat, city.lng ], { title: city.name } );
    marker.on( 'click', function () {
        window.location = city.url;
    } );
    marker.addTo( map );
} );
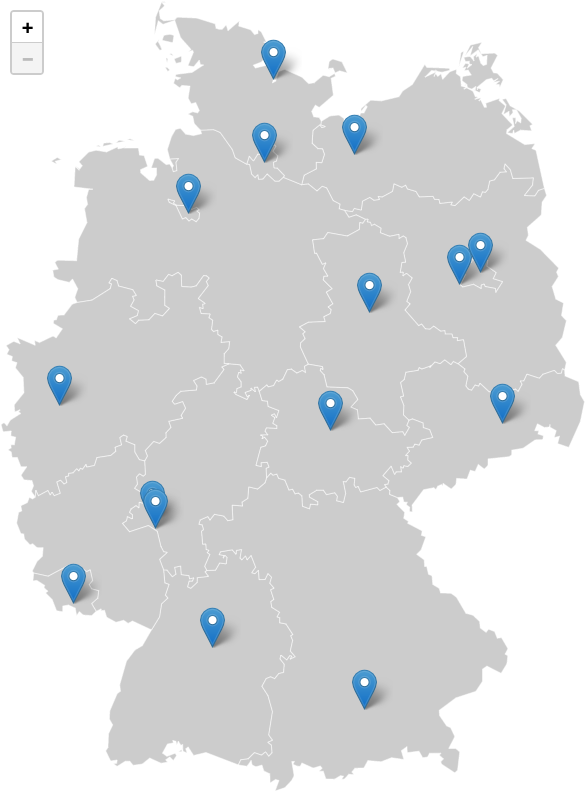
This will get us the following result (when hovering over the markers, you would also see the city’s name as a title):
By default, we can zoom into the map, but also out. This is not really ideal for an image overlay. Also, when zooming out, we want to center our map into the container again. This can both be solved with the following code, I have used for the map:
// Set the current min zoom to the zoom level after init.
map.setMinZoom( map.getZoom() );

// Re-center the map when zoomed to minZoom level.
map.on( 'zoomend', function () {
    if ( map.getZoom() === map.getMinZoom() ) {
        map.fitBounds( imageBounds );
    }
} );
Conclusion
In the last three blog posts, you have learned how you can use your own images to create your own individual maps. If you just need a static map, then the PHP approach might be best for you. If you need an interactive map with some features you know from Google Maps (like zooming, etc.), you might want to use Leaflet.
If you want to test the code yourself, you can again find a working version in a new branch on GitHub. I’ve combined everything in a single HTML file, but in a WordPress plugin/theme you can also split them to different files.
I still have an idea for a little “bonus blog post” in this series, so you might get another topic on interactive and individual map. ☺️