As mentioned in my last blog post, I have a little bonus topic to the maps series. In the previous post, we have created a map with Leaflet in JavaScript. The map visualized the capital cities of all German states. Two of them are so close together, that there are hard to click. But how about having a map with all big cities with around 100,000 or more inhabitants:
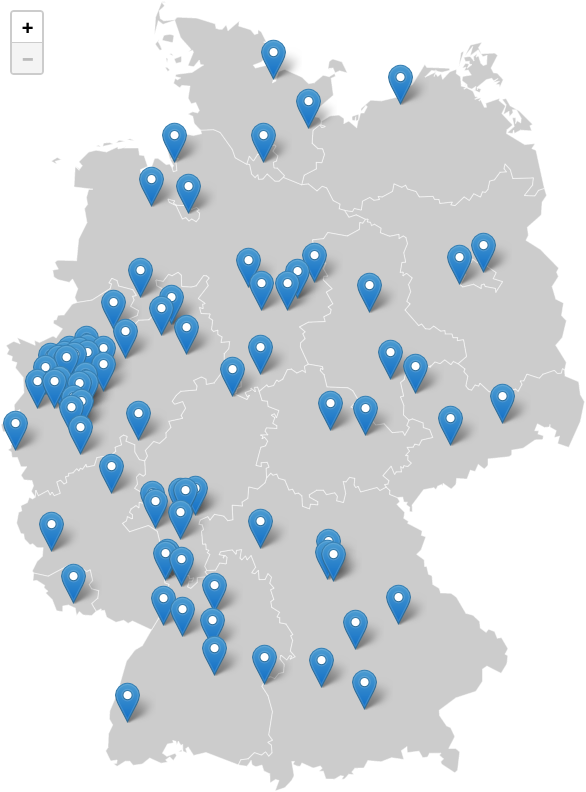
Now, especially in North Rhine-Westphalia, it is impossible to see, hover and click all makers. But as we are using Leaflet there is a solution for this:
Use marker cluster
There is an extension for Leaflet called Leaflet.markercluster, which we can use to cluster the markers. In order to use it, we first have to import some more external CSS and JavaScript files:
<link rel="stylesheet"
      href="https://unpkg.com/[email protected]/dist/MarkerCluster.css"
      integrity="sha256-YU3qCpj/P06tdPBJGPax0bm6Q1wltfwjsho5TR4+TYc="
      crossorigin=""/>
<link rel="stylesheet"
      href="https://unpkg.com/[email protected]/dist/MarkerCluster.Default.css"
      integrity="sha256-YSWCMtmNZNwqex4CEw1nQhvFub2lmU7vcCKP+XVwwXA="
      crossorigin=""/>

<script src="https://unpkg.com/[email protected]/dist/leaflet.markercluster.js"
        integrity="sha256-Hk4dIpcqOSb0hZjgyvFOP+cEmDXUKKNE/tT542ZbNQg="
        crossorigin=""></script>
Now we can create a markerClusterGroup and add the markers to this group. At the end, you have to add the marker group to the map:
const markers = L.markerClusterGroup();

cities.map( city => {
    let marker = L.marker( [ city.lat, city.lng ], { title: city.name } );
    marker.on( 'click', function () {
        window.location = city.url;
    } );
    markers.addLayer( marker );
} );

markers.addTo( map );
By default, the markers are clusters with a max radius of 80 pixels. The map of Germany would then look like this:
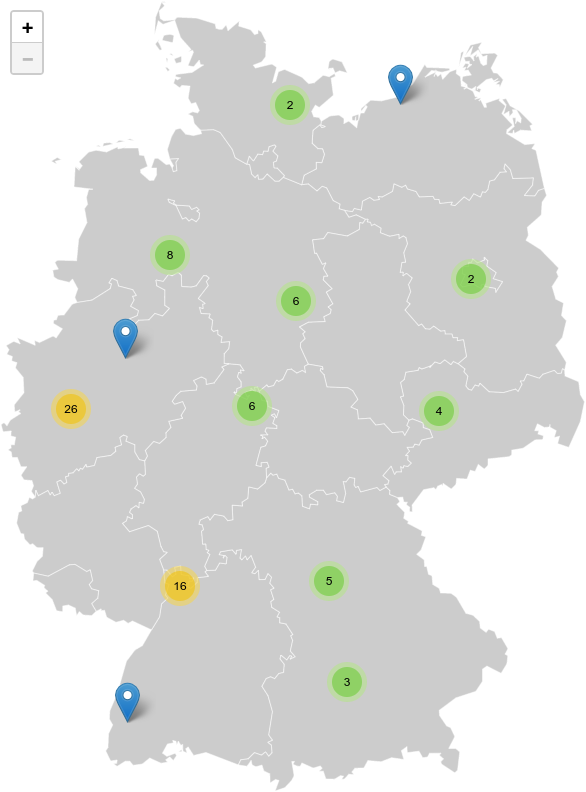
While this might be the most efficient clustering, it doesn’t look really nice, as we have multiple clusters in one state and none in others. That’s why I am going to cluster them by state.
Cluster markers by state
We can add multiple markerClusterGroup objects to the map. We create 16 groups for the 16 states and then add the markers to the correct group. Let’s take a look at the complete code:
const stateMarkers = {};

// Get a unique list of all states from the cities array.
[ ...new Set( cities.map( city => city.state ) ) ].map( state => {
    // Create a markerClusterGroup per state.
    stateMarkers[state] = L.markerClusterGroup( {
        maxClusterRadius: 1000,
        spiderfyOnMaxZoom: false,
        showCoverageOnHover: false,
        disableClusteringAtZoom: 8,
    } );
} );

// Create city markers and add them to the correct markerClusterGroup.
cities.map( city => {
    let marker = L.marker( [ city.lat, city.lng ], { title: city.name } );
    marker.on( 'click', function () {
        window.location = city.url;
    } );
    stateMarkers[city.state].addLayer( marker );
} );

// Add all markerClusterGroups to the map.
Object.keys( stateMarkers ).map( state => {
    stateMarkers[state].addTo( map );
} );
First, we create an object for the groups of all states. Then we do some JavaScript magic to get a unique list of all state names from the cities objects and create one marker group. For the cluster groups, we set the maxClusterRadius to 1000 pixels, as our map is smaller than 1000 pixels, which results in cluster groups being at least as big as any state on the map. We also disable two options, we don’t really need. We also define, that on a zoom level of 8, all clusters should be disabled. This will “uncluster” all markers when any of the clusters is clicked.
After we have created the groups, we create and add the city markers to those groups. At the end, we add all groups to the map. This will finally give us the following result (a screenshot):
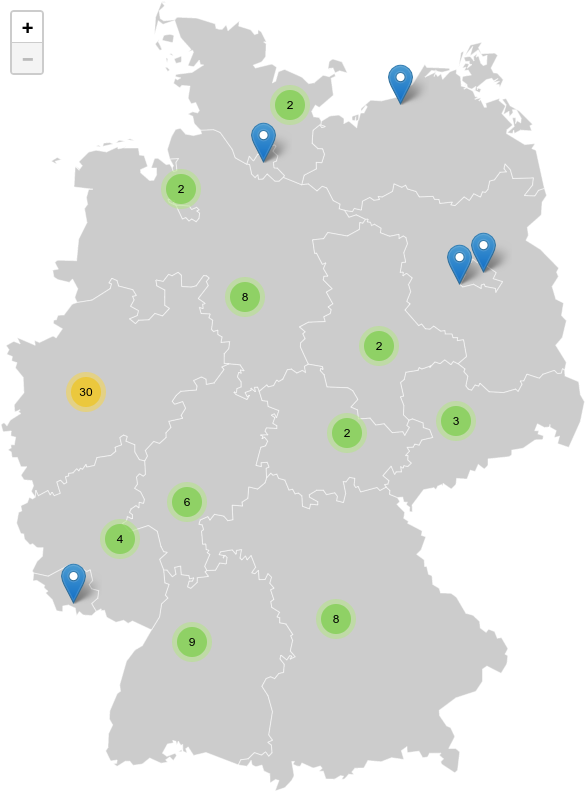
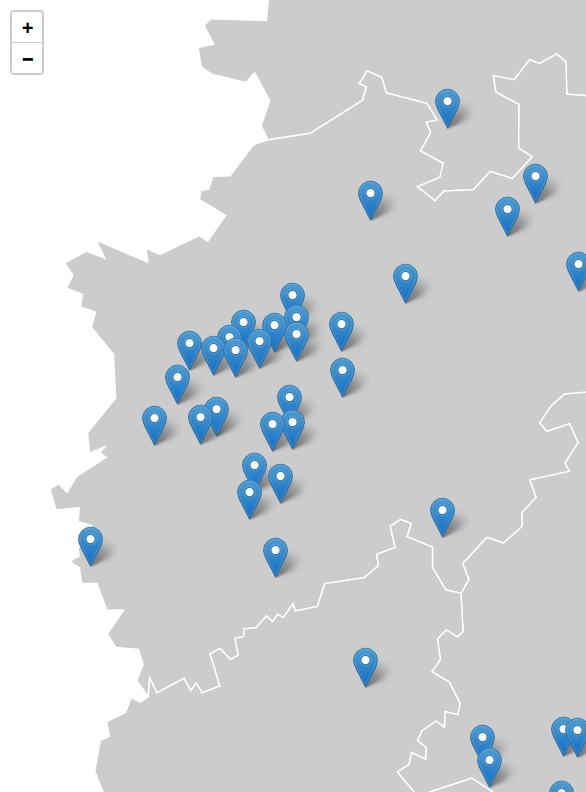
Some of the states do not have more than one marker. In this case, they are just shown. All others have a cluster. For North Rhine-Westphalia, we have a cluster of 30 markers. If we click on that cluster, we get the following zoomed view (screenshot):
If your map has more markers, or they are closer, you might have to tweak the options for the cluster groups. For this example, I would say they are now clickable.
Conclusion
This should be the last blog post to my little maps series. There are probably dozens of other possible topics around maps in general and Leaflet, but other blogs and documentation cover them already.
I really hope, that you are curious now to try to create your own (dynamic) maps. And finally, you can also find all examples from this blog post in a single HTML file in a new branch on GitHub.
If you still have topics you want me to cover, please leave a comment.