This blog post covers an element, that is very similar to the progress element I have covered in a previous blog post. It is used to display some kind of “level” like of a battery or “score” like in on online test. Those visualizations are usually defined by a min and max value.
A basic example of the meter element
Let’s start with a very basic example that has all the attributes it needs to function. This is what we have to implement:
<label for="score">Score:</label>
<meter id="score" value="0.5">50%</meter>
OK, the associated <label> is optional, but as you probably know me by now, I always try to give examples with good accessibility in mind.
The element has a min attribute, which defaults to 0 if not defined, whereas max is set to 1. So, if we don’t define them, we would use a value range between 0 and 1 and therefore our value of 0.5 would represent 50% on the meter. The result would look like this:

Similar to the <progress> element, we don’t see the “text node” that says “50%”. This is only shown if the element is not supported by the browser.
Using the additional attributes to make it more useful
With the <progress> element, we only had a max and value attribute. The <meter> element has a lot more, and they make the big difference between the two elements. Here is an example with all the attributes you can use:
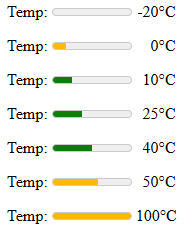
<meter min="-20" max="100" low="10" high="40" optimum="25" value="10">10°C</meter>
We can explicitly set the min and max attributes. The min attributes is also not fixed to 0, it can have any value, even negative ones, like you could have a meter representing a temperature below zero. This is how that would look like for some different temperature values:

By setting an optimum value between the low and high attribute values (it could have any value between 10 and 40), this range will be indicated with a green background. Any range below min or above high will be shown in yellow.
A meter with three different colors
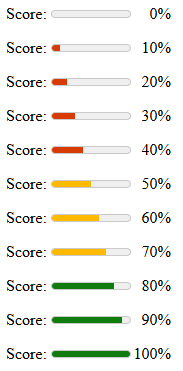
Let’s take another example with a score on a test. We would define the test as “passed”, when you get 50% or more, and it would be “good” if you have 80% or more. These elements would represent different scores:
<meter min="0" max="100" low="50" high="80" optimum="100" value="0">    0%</meter>
<meter min="0" max="100" low="50" high="80" optimum="100" value="10">  10%</meter>
<meter min="0" max="100" low="50" high="80" optimum="100" value="20">  20%</meter>
<meter min="0" max="100" low="50" high="80" optimum="100" value="30">  30%</meter>
<meter min="0" max="100" low="50" high="80" optimum="100" value="40">  40%</meter>
<meter min="0" max="100" low="50" high="80" optimum="100" value="50">  50%</meter>
<meter min="0" max="100" low="50" high="80" optimum="100" value="60">  60%</meter>
<meter min="0" max="100" low="50" high="80" optimum="100" value="70">  70%</meter>
<meter min="0" max="100" low="50" high="80" optimum="100" value="80">  80%</meter>
<meter min="0" max="100" low="50" high="80" optimum="100" value="90">  90%</meter>
<meter min="0" max="100" low="50" high="80" optimum="100" value="100">100%</meter>
You can see, that now our optimum is between high and max. When the value of optimum is larger than the value of max (we just set it to 100), we get three different background colors:

This represents our score definition perfectly, right? If you are unclear how to set attributes values, check the documentation and test some different values in some different browsers.
Styling the element
There are only few CSS properties you can use in WebKit browsers and for Safari you even need some JavaScript hack to make them work. You will find them linked in the “See more” section of the documentation.
In Chrome, you could combine them with an attribute selector to change the background color of the exact “optimum value” for the temperature example like this:
meter[value="25"]::-webkit-meter-optimum-value {
	background-color: blue;
}
But in Firefox that would have no effect. As soon as you change the background of the element, it will look very different (like if you use “appearance: none” on it). I’d suggest you just experiment with the element a bit.
Conclusion
The <meter> element is probably one more lesser known elements, but it can be a nice addition to your UI to visualize some numbers. For the <progress> element, we had the ProgressBar component for WordPress, but for <meter>, we don’t have such a component, yet.