This blog post is not going to cover the basic topic on how to debug JavaScript code in your browser. We could probably have a full advent calendar covering all the aspects. But I want to introduce a neat little keyword for your debugging toolbox.
Setting a breakpoint in the browser
When you want to debug some JavaScript code, you probably set some breakpoint in your code at some point. If you have a small JavaScript file that is nicely formatted, it might look like this in Chrome:
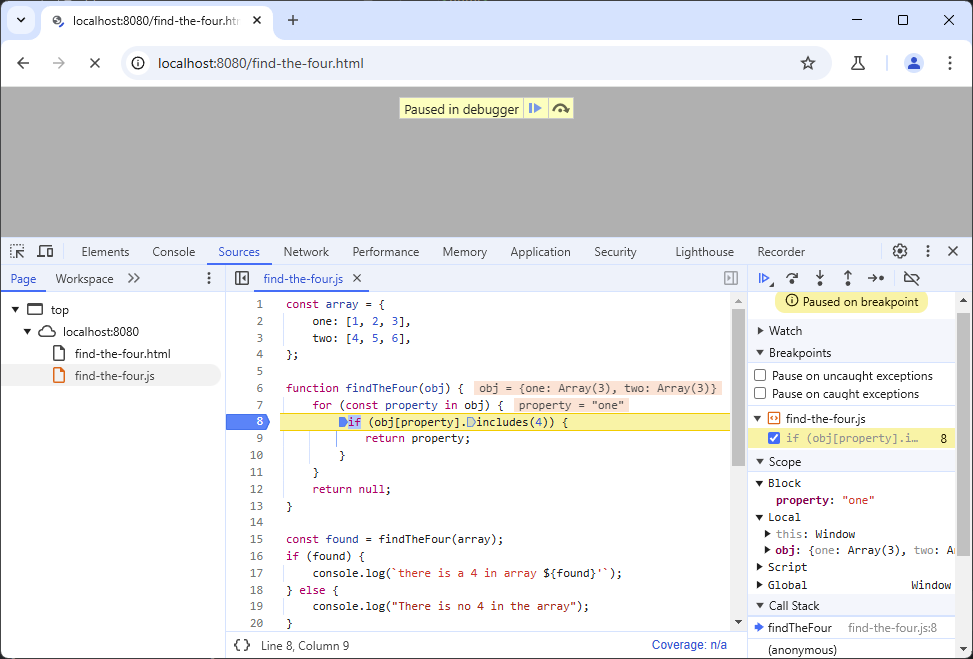
You would open the dev tools, navigate to the JavaScript file in the “Sources” tab, set a break point and reload the page. Chrome will then stop at the line and you can debug your code.
The issue with compiled JavaScript code
Those of you developing code with React, Vue, etc. and using webpack or similar tools to compile your code, will not have such nicely formatted code that is also easy to read. Let’s throw in our code from above into the compiling workflow from the @wordpress/scripts package and compile it:
npm run build
Now we get a compiled “production” file, and our nicely formatted code is now only a single line in this compiled file:
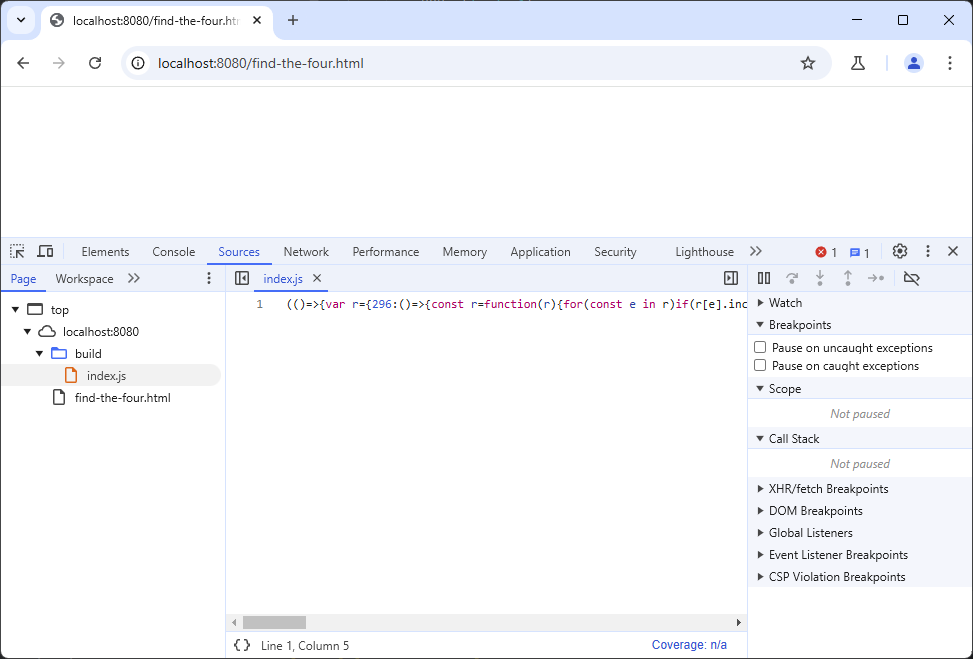
How do we set a breakpoint now? If you want to set a breakpoint in a “single line JavaScript” file, there is a little feature you can use. Just click on the “{}” icon (“Pretty print”) in the bottom left of the middle column, and you will get something like this, where you can set a breakpoint in the “virtual line”:
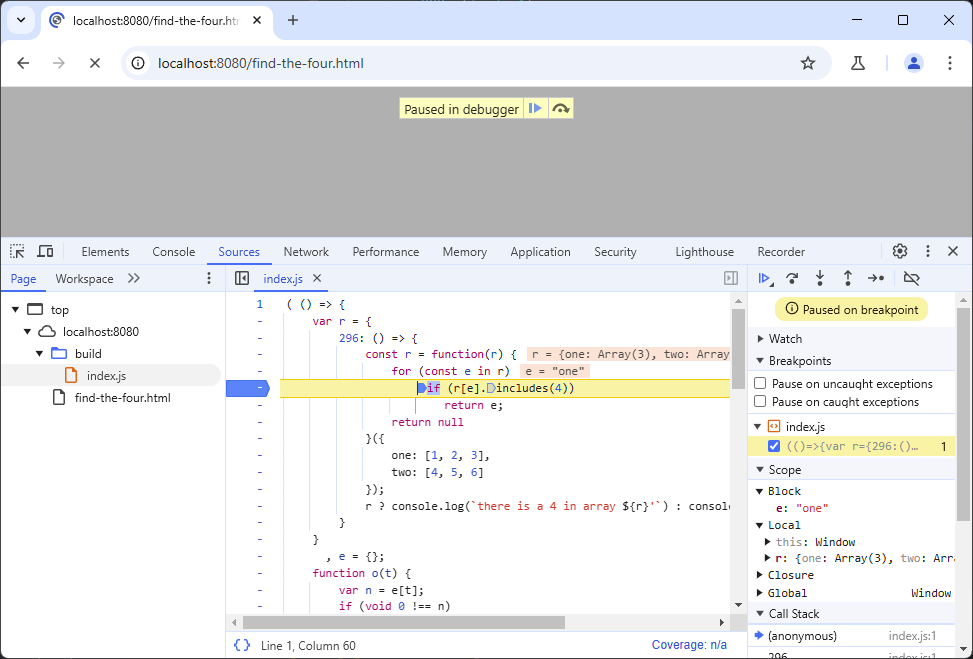
That kind of works. But if you want to debug the console.log() calls at the end of the file, they are still in one line and additionally in a ternary operator.
Using the debugger keyword for a “forced breakpoint”
After this short introduction, we now come to the keyword, I wanted to talk about today. While you develop your code, you can add the debugger keyword to any line of your code, which will force the browser to pause on that line. Let’s use it in the compiled version to debug the “if” portion of the ternary operator. We use a different command now to get the “development version” that would also start a watcher and compile the code as soon as we change something:
npm run start
In our JavaScript code, we also add the debugger keyword like this to the if/else at the end:
if (found) {
    debugger;
    console.log(`there is a 4 in array ${found}'`);
} else {
    console.log("There is no 4 in the array");
}
If we refresh the browser now, it will stop at this keyword in line 17. We don’t have to add a breakpoint here:
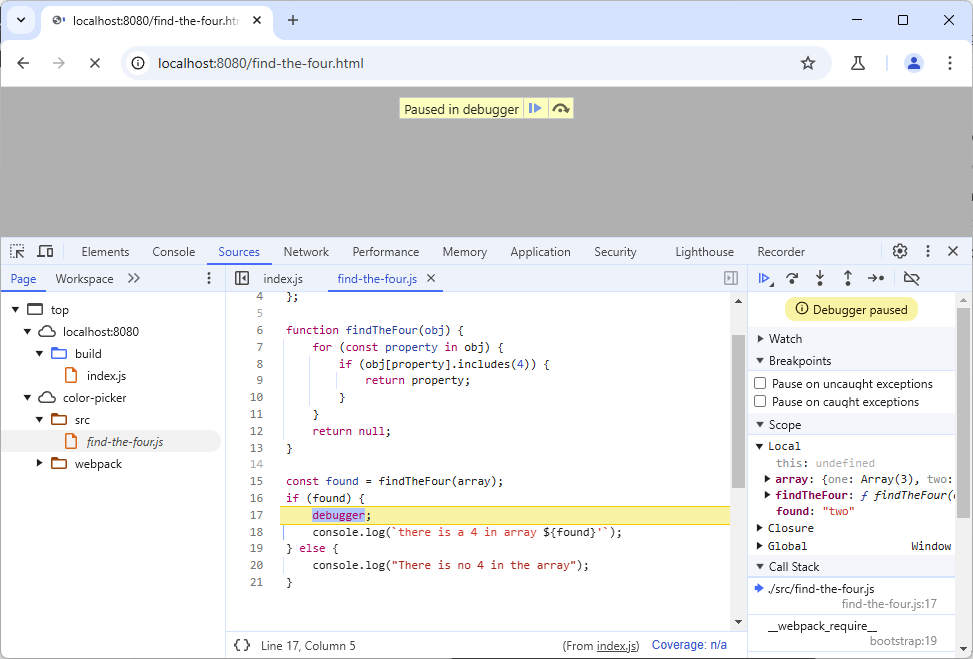
In the top right you can see “Debugger paused” and the script stopped, just as with a breakpoint set by us manually in this view. We can now continue with our debugging.
Using the debugger keyword in minified files
First of all: you probably shouldn’t do that. If you use the “build” script, you are usually creating files for production, and these should not have a debugger keyword in them. That’s why the minification webpack plugin is removing this keyword. If, for whatever reason, you do want to have the debugger keyword in the compiled files, you need to write a custom webpack.config.js webpack configuration file:
const defaultConfig = require('@wordpress/scripts/config/webpack.config');
const TerserPlugin = require('terser-webpack-plugin');

module.exports = {
    ...defaultConfig,
    optimization: {
        ...defaultConfig.optimization,
        minimize: true,
        minimizer: [
            new TerserPlugin({
                terserOptions: {
                    compress: {
                        drop_debugger: false,
                    },
                },
            }),
        ],
    },
};
If we run npm run build now and refresh the browser, we will see the keyword and the browser stops there:
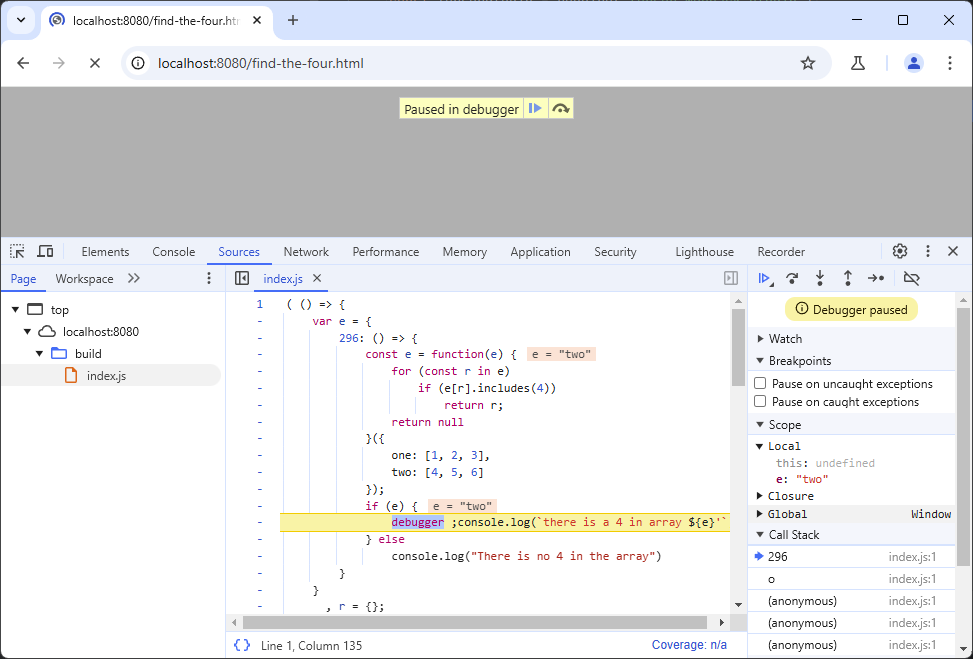
This would also automatically trigger the “Pretty print” icon in the bottom left and show you the code like above.
Conclusion
It may sometimes be hard to set a breakpoint manually, especially if your JavaScript files get compiled, combined and even minified, and you have no idea where a line you just wrote end up. You can also just set the debugger keyword temporarily, and once the script stopped, set a regular breakpoint, to remove the keyword right away, so you also don’t accidentally publish code with the keyword inside.