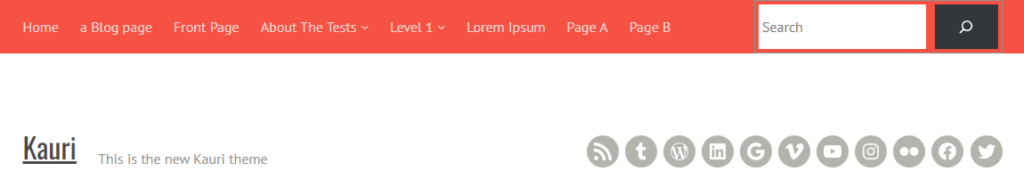
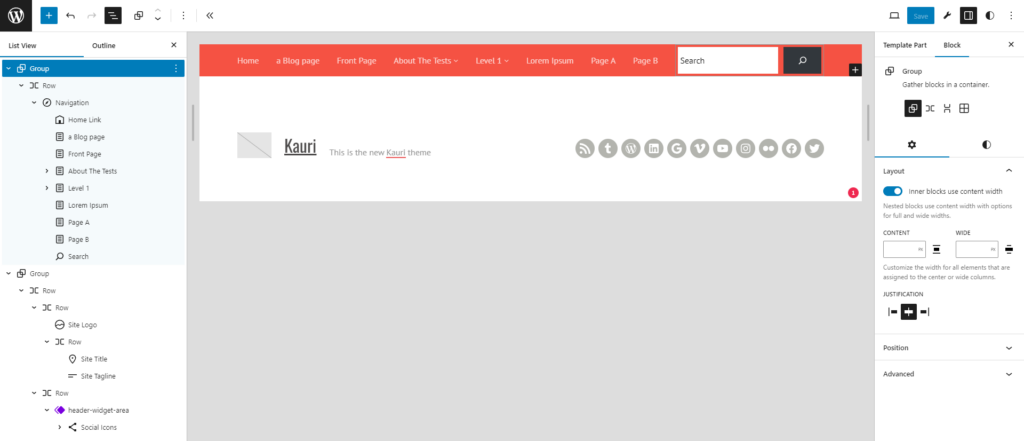
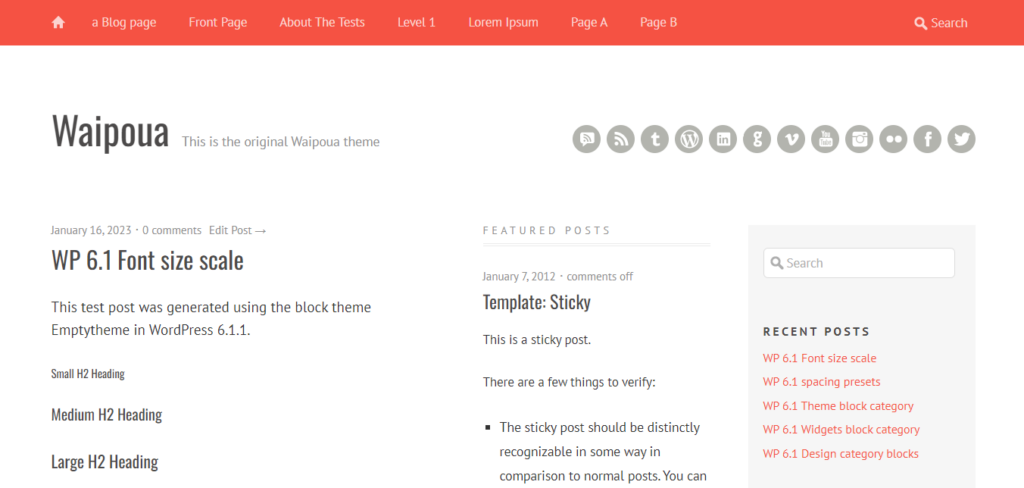
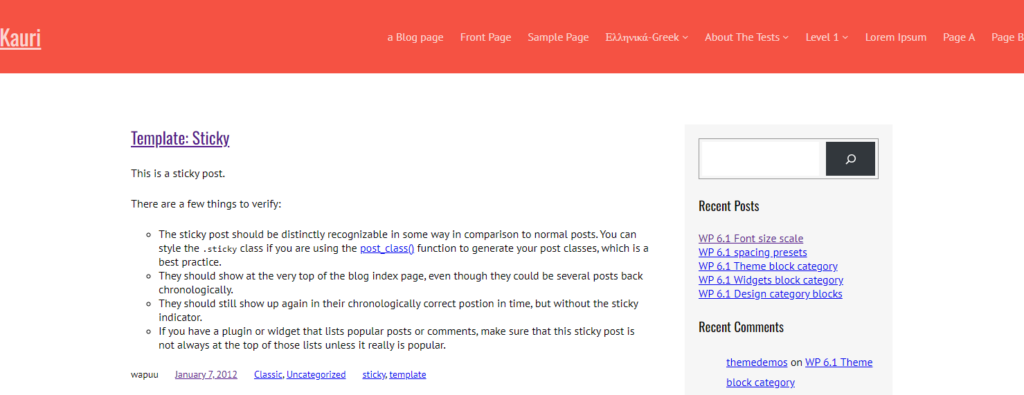
Using git for your server configuration files

I recently got myself a new web server. On this new server, I’m playing around with OpenLiteSpeed, which I have never used before. It comes with its own admin dashboard to manage the server. But it writes everything into configuration files.

Sometimes you also want or need to manipulate configurations files manually. If not for OpenLiteSpeed, then maybe the SQL or PHP configuration. But if you don’t really know what you do, you can easily screw things up.

Versioning your configuration files

This is why I have started to put my main configuration files under version control. This has several benefits:

  • You can try things and revert them, if things are get broken
  • You have a “backup” of your configuration
  • You can use the same/similar configuration files on all your servers and synchronize them
  • You can see changes made by other processes – like after an update or when using configuration tools

Only version the most important files and ignore sensitive information

On many Linux server systems, the configuration files are stored in the /etc folder. You may not think that you simply version that whole directory. But that’s not a good idea, as you might version files that contain sensitive information or that would even screw up your whole server, if you do something wrong. I once accidentally deleted the /etc/passwd file, which was not really good. ?

Ignoring nginx configuration files

So on my old server, I’ve versioned only the /etc/php and the /etc/nginx folders in two separate git repositories. For the nginx configurations, I used the following .gitignore file:

# /etc/nginx/.gitignore
*param*.pem
sites-enabled/
modules-enabled/
modules-available/

The second line ignores the dhparam-4096.pem files being used for better Diffie-Hellman key. I also ignored the *-enabled folder, which are just symlinks to the *-available folders. You can version them, if you want to keep track of which sites and modules are enabled. The modules-available also didn’t have too much value in my opinion, so I left this one out as well.

Ignoring OpenLiteSpeed configuration files

On the new server, I’m still figuring out how configuration files are structured. The OpenLiteSpeed files are stored in the folder /usr/local/lsws and as of now, I use the following .gitignore file:

# /usr/local/lsws/.gitignore
# Ignore all files by default but decent into subfolders
*
!*/

# Allow just some files and subfolders
!.gitignore
!/conf/**
!/lsphp*/**
!/php/**

# Still ignore some files and folders in those subfolders
*.conf.bak
*.conf.dpkg
*.conf.txt
*.conf0
*.conf0,v
*.properties0
*.properties0,v
/lsphp*/bin/
/lsphp*/include/
/lsphp*/lib/
/lsphp*/share/man/

As the /usr/local/lsws folder also contains binaries and log files, I’ve first ignored all files and folder. I then added only those folders containing the configuration files I wanted to put under version control.

When I upgrade some packages, a lot of “backup configuration files” appeared, so I ignored all with those file extensions in the previously allowed folders.

I might update this ignore list in the future, but as of now, I have all my files I want to have under version control.

Push the repository to a remote

As mentioned in the benefits, you might also use this approach to have a “backup” of your configuration files. While git (or any other version control system) is not an alternative to a backup, it can be a bonus to have them stored on some external server. As those configuration files are often not meant to be public, I use private git repositories on GitLab.com as my remote.

This also has the benefit, that I clone the repositories to my laptop and edit the configuration files in PhpStorm, which is a lot easier than using vim on the server. And I can also easily compare changes and revert some commits.

Automatically version changes

I usually do the commits (and pushes) manually. But in case you have changes to those files made by other processes, and you want to version every change, you could set up a cron to commit all changes. This is an example of a cron, that would auto-commit and push all changes to the nginx configuration files every 30 minutes:

30 * * * * cd /etc/nginx && git add -A && git commit -m "auto commit on `date`" && git push

Even new and deleted files would be versioned. But having a cron like this could also potentially result in a lot of commits, if you don’t have your ignores set correctly, as some of the new files might have been a log file that is changed quite frequently. So if you use a cron, you should check the auto-commits from time to time.

Conclusion

I really love git! You can use it for so many different things. Versioning my configuration files has saved me a lot of time trying to figure out why things are suddenly broken or when I wanted to make changes to many configuration files at once (editing them locally in PhpStrom).

Do you use a similar approach and might want to share your setup here as well? Or do you use git for other things? Then please leave a comment.

WordCamp Asia 2023 – Finally, my first trip to Asia!

About two weeks ago, I was preparing myself for a long trip to Thailand. This would also be my first trip to Asia. After WordCamp Asia was canceled in 2020 just 9 days before the event, it finally happened in 2023! It was the first edition of this new flagship event.

Travelling to Thailand

I haven’t really planned the day perfectly. The flight from Berlin was going at 08:55 in the morning. As it Super Bowl Sunday, I was facing myself with very little sleep. (Un)fortunately I didn’t felt well Sunday evening, so I went to bed really early and skipped watching the Super Bowl live 🙁

But with some good sleep, I arrived a BER airport and took my first flight to Helsinki. From there I took the second flight to Bangkok. The around 11 hours went by quite fast, enjoying some entertainment. As I cannot sleep in planes, I arrived a little tired 06:00 local time. From the airport I took a train to the city and then the metro. Walking to the hotel, I got some first experiences on how Thailand is different to Europe, especially in terms of traffic. But I was also quite surprised of the many street food places on my walk. Checking was only at 14:00, but fortunately I was able to get my room at around 10:00 paying only 300 baht (around 9€) extra. So after almost 24 hours of traveling, I finally got some good sleep 🙂

On Tuesday and Wednesday I had the chance to see a bit of the city. Wednesday was the only day of my trip with some rain (at times quite heavy), but I managed to meet some people to experience China Town. It first seemed a bit odd to visit an Asian country and then go to China Town, but it was pretty fascinating. I also took one of the ferries on the river, one of the really fast ones!

Meeting the community

On Thursday, I moved hotels and met with my colleagues from Inpsyde. We stayed at the main hotel right next to the venue. Just hanging around in the lobby, you met many WordPress community members. Some of them I haven’t seen for quite a while. Well, even when they also have been to WCEU in Porto, I was just too busy to talk to them. Before heading to some side events, I briefly visited one of the many temples in Bangkok:

Click here to display content from Twitter.
Learn more in Twitter’s privacy policy.

The first side event was “The WordPress Enterprise Gap” hosted by Human Made. It was like a WordPress meetup with some talks and a panel. The topics were around how to attract enterprise clients to WordPress.

Click here to display content from Twitter.
Learn more in Twitter’s privacy policy.

I would have loved to join the “GoDaddy Pro Island” party on a boat, as I really liked this event in Porto, but it overlapped with the other events. So I then joined some colleagues and friends at the “WooCommerce Community” event. It was a nice location next to the river and I had some good talks … even though I’m personally not too much into eCommerce in general 🙂

The last side event of the day was the “Superheroes Pride Party” organized by Yoast, codeable and Bluehost. As the location was the hotel I was staying, it was a perfect end of the day. And it was a lot of fun for many people.

Click here to display content from Twitter.
Learn more in Twitter’s privacy policy.

Contributor Day

On Friday, WordCamp Asia officially started with its Contributor Day. I wasn’t really sure which team I would join, but as I’ve met Alex there, and he had some questions regarding the ticketing/registration on WordCamps, I joined the Meta Team again. We both tried to set up a local environment for WordCamp.org … but failed ? But I was able to fix some issues, created a PR with one fix and an issue for the other problem. Hopefully we can fix this for new contributors before the next WordCamp.

In the evening I went for dinner with my colleague Viola. First, we took a look at the many different food places in the venue, but were overwhelmed with the options. We then finally found a nice little restaurant just down the street serving some great Thai dishes.

The first conference day

Saturday was the first conference day. As for any flagship WordCamp, it started off with the Opening Remarks:

Click here to display content from Twitter.
Learn more in Twitter’s privacy policy.

The schedule was packed with many great topics. But I’ve skipped the first slot to talk to some old WordPress friends I haven’t seen since WCEU Berlin in 2019.

Advanced Performance & Scalability for PHP Developers

In the second slot, I attended the session presented by Alain Schlesser. One topic of this talk was surrounding caches. He gave some great advice on how to cache things, on different levels and in a granular way, and how to invalidate the cache when necessary.

Think like a hacker: Attack your WordPress

After this I watched Matthias Held hacking a website live on stage of one of the attendees. But he was not hacking the live website, only a copy and the attendee volunteered for this 🙂 Even though there were not too many security issues, Matthias was able to showcase how a XSS attack could be used to steal the PHP session of a logged in (administrator) user through a manipulated link in an outdated and vulnerable plugin.

Success stories of HeroPress

After lunch break, Topher DeRosia shared some stories from HeroPress. I’m following his projects for many years now, and many friends from the WordPress community have already posted their essays there. Maybe one day I will share my story as well.

The Ultimate Newsroom QA: how to manage your editorial workflow like a boss

Being a solo blogger, things are easy for me. I just need to decide what I want to blog about and write it down. Blogging in a larger team is more challenging, and Francesca Marano gave a lot of insights on how she successfully ran an Italian blog with many different authors.

Click here to display content from Twitter.
Learn more in Twitter’s privacy policy.

Meeting the sponsors

No WordCamp would be possible without the sponsors. In the next two slot, I skipped the sessions and talked to different sponsors. Many of my WordPress friends work for some of them, and it was nice to catch up how they have been in the last few years.

Migrating WordPress Core to GitHub Actions: A Retrospective

The last session I’ve attended on the first day was held by Jonathan Desrosiers in which he presented some insight on how WordPress migrated all automated tests to GitHub actions.

Thai dinner with the team

The first two days were quite busy, and we finally took the time to have a team dinner with all Inpsyders attending the event. We took a ferry to “Asiatique The Riverfront” and had a large variety of Thai food. On the way back, we took a tuk tuk, something I have never done before. Back at the hotel, we met some other WordCamp attendees in the bar at the top of the hotel.

The second conference day

As the previous day ended quite late – or early – I took some good sleep to have enough energy for the second half of talks.

AMA – Ask Matt Anything

That’s why I only watched the first talk using the live stream. Matt also couldn’t join, as he had to care for his family. But some of the questions he got asked were quite interesting. I still have to watch the full session, but he casually announced that Gutenberg phase 3 is starting now.

Click here to display content from Twitter.
Learn more in Twitter’s privacy policy.

Stepping Back To Move Forward

After some coffee and a small breakfast snack, I joined the first lightning talk by Carole Olinger. Her talk was the first of three lightning talks focussing on mental health. These are the types of talks I really like to attend on WordCamps. One of the things she presented was the concept of JOMO – Joy of Missing Out – to make us aware that it’s OK not to always participate in all things possible.

Click here to display content from Twitter.
Learn more in Twitter’s privacy policy.

The Power Of Empathy

The second mental health lightning talk was focussing on empathy and presented by Ajit Bohra. This is the quote I liked most in his talk:

Click here to display content from Twitter.
Learn more in Twitter’s privacy policy.

Look for the Good

The last talk was held by Michelle Frechette, and she was speaking about times can be hard – like the past years with the pandemic – but also about how she and many of us have been finding new opportunities in those challenging times.

Click here to display content from Twitter.
Learn more in Twitter’s privacy policy.

Panel: Building WordPress Communities in Your Country

Then I’ve attended the only panel of WordCamp Asia. Rahul D Sarker, M Asif Rahman, Miriam Schwab, Amit Bajracharya, Angela Jin and Hajime Ogushi were talking about their local communities and answered many questions from the audience on how to build a strong community in a country.

Ten Minutes on Five for the Future: A commitment to WordPress and the Open Web

After the lunch break, Hari Shanker presented the “Five for the Future” initiative of WordPress. The goal is to encourage every company using WordPress to give back 5% to the open source project. In the Q&A I’ve asked on how individual contributions could be highlighted a bit more, as currently, there is only a listing of companies. Hari also wrote a blog post on Make WordPress and I will probably make some suggestions on how we could show all these people helping the projects while not working for a company.

Click here to display content from Twitter.
Learn more in Twitter’s privacy policy.

Spending more time with friends

Two people I was looking forward most at WordCamp Asia were Ellen and Manuel the couple behind Elmastudio and AinoBlocks. I have not talked to them since Contributor Day at WCEU 2019 and was really happy to catch up.

Click here to display content from Twitter.
Learn more in Twitter’s privacy policy.

Closing Remarks … and the announcement of the next host city

Following the tradition of flagship events, in the closing remarks all people involved were asked to join the organizers on stage. Around 1300 attendees made it to the first edition of WordCamp Asia. At the very end, the new host city was announced:

Click here to display content from Twitter.
Learn more in Twitter’s privacy policy.

So next year we will meet in Taipei, Taiwan! I really hope that I can make it again to see yet another new Asian country. I want to thank all the organizers of WordCamp Asia 2023 and wish the team all the best!

Click here to display content from Twitter.
Learn more in Twitter’s privacy policy.

After Party!!!

Sure, there was an after party at WordCamp Asia 😉 It was a large open air venue with some (live) music, amazing food and some dances I haven’t seen before 🙂

Click here to display content from Twitter.
Learn more in Twitter’s privacy policy.

If you want to see more pictures, just follow up on the #WCAsia hashtag on Twitter or take a look at the shared gallery with pictures from many attendees.

Workation in Thailand

On Monday, we headed to a place around 3h south-west of Bangkok. I could only spend one day with my colleagues, but it was a nice finish of my trip:

Click here to display content from Twitter.
Learn more in Twitter’s privacy policy.

A WordCamp of “first times”

Visiting WordCamp Asia was my first trip to Asia. It was also the first WordCamp Asia. It was the first (in-person) WordCamp being only an attendee for quite a while. And it was the first time I was attending a WordCamp since I started my new job at Inpsyde last October. My next WordCamp will probably be WordCamp Vienna, followed by WordCamp Europe in Athens, this time probably as a speaker. I want to close this blog post with the after movie my colleague Viola produced:

Click here to display content from Twitter.
Learn more in Twitter’s privacy policy.

Use SSH keys to sign Git commits

In November last year, I have explained, how you can use different Git settings for personal and company projects. In one of the snippets, I have used an SSH key to sign commits. But as in the past, commits were usually signed using GPG keys, I want to explain what you have to do, to use an SSH key to sign your commits.

Step 0: Create an SSH key pair

You probably already have a key pair. How else would you clone repositories from Git hosting platforms? But in case you don’t have an SSH key pair, run this command:

ssh-keygen -t ed25519 -C [email protected]

I would recommend using the ed25519 cipher algorithm. You can also set the comment, otherwise it would be user@machine from the machine you are creating the key on. I would also recommend setting a passphrase, but it’s not necessary for using the key to sign commits.

Step 1: Update your Git configuration

Now that we have an SSH key, we can add it to our configuration. We can do that with the following command:

git config --global user.signingkey ~/.ssh/id_ed25519

As Git is still using GPG keys by default to sign commit, you have to tell it to use SSH keys instead. This can be done adding this settings:

git config --global gpg.format ssh

If you have never signed commits before and want to sign all commits by default, run this command:

git config --global commit.gpgsign true

Don’t get confused, that the setting is called gpgsign, it will still sign your commits using SSH.

Step 2: Define the “allowed signers” (optional)

When you commit something and then show the log including signatures, you will see the following error:

git log --show-signature
error: gpg.ssh.allowedSignersFile needs to be configured and exist for ssh signature verification
commit eccdf56431b052772b09027c5cea585b8e7eee32 (HEAD -> master)
No signature
Author: Jo Doe <[email protected]>
Date:   Sun Jan 29 19:07:52 2023 +0000

This is because Git does not know if any of the public keys is valid. We can fix this by adding another setting to our git configuration:

git config --global gpg.ssh.allowedSignersFile ~/.git_allowed_signers

And now we also have to create this file, otherwise we would get a different error. You add one public key per line, with the email address of the key in the first “column” and the content of the public key after this. The file could look like this:

# ~/.git_allowed_signers
[email protected] ssh-ed25519 AAAAC3NzaC1lZDI1NTE5AAAAIJ818qdUM98GriqpTKhqMmwYAgeK3iiCg07Qgya5NwN/ [email protected]

When you show the Git log again, you should see a valid signature:

git log --show-signature
commit eccdf56431b052772b09027c5cea585b8e7eee32 (HEAD -> master)
Good "git" signature for [email protected] with ED25519 key SHA256:/qGkPHs1/58u7jZgX95+hr5PNFs7gXswbkcRdfZuMWk
Author: Jo Doe <[email protected]>
Date:   Sun Jan 29 19:07:52 2023 +0000

After these steps, your Git configuration should (at least) look like this:

[user]
	email = [email protected]
	name = Jo Doe
	signingkey = ~/.ssh/id_ed25519
[commit]
	gpgsign = true
[gpg]
	format = ssh
[gpg "ssh"]
	allowedSignersFile = ~/.git_allowed_signers

Step 3: Add key to Git hosting platforms

Many of you will probably use GitHub, GitLab or other Git hosting platforms. At least the two mentioned platforms also support SSH keys for signing in their UI.

Add the key to GitHub

Navigate to “Settings | SSH and GPG keys“. Then click the “New SSH key” Button. In the “Key type”, choose “Signing Key”. Add your public key and give it a title:

Screenshot of the "New SSH key" form with the inserted public key.

You can use the same key, as you might have already used for the “Authentication Key”.

Add the key to GitLab

Navigate to “Preferences (User Settings) | SSH Keys“. Here, you can insert the key into the form and either choose “Authentication & Signing” or just “Signing” in the “Usage type” dropdown:

Screenshot of the "Add an SSH key" form with the inserted public key.

By default, the keys at GitLab have an “Expiration date”, but you can also leave this empty. You can always extend the validation by deleting the key and adding it again. Since SSH keys do not expire (GPG keys usually do), you might want to give the default date a try.

Step 4: Verify that commits are signed

We have already checked on the terminal in the Git log, that our signature is correct. On GitHub and GitLab, you can see the signed signature check on most views with a commit hash. In the commits list of GitHub, it looks like this:

Screenshot of a "Verified" commit on GitHub.

In the commits lists of GitLab, it looks like this:

Screenshot of a "Verified" commit on GitLab.

The SSH key fingerprint is the same, as we have seen in the Git log on the terminal already: /qGkPHs1/58u7jZgX95+hr5PNFs7gXswbkcRdfZuMWk.

Conclusion

For a long time, GPG keys were the ones to use when signing off commits. But since GPG can be quite complex to set up and manage, not too many people used commit signing. If you don’t use GPG already – like for signing and/or encrypting emails – you might just use SSH keys instead to sign your commits. But you can also use both for different projects. In this case, just read my blog post about different Git configurations again, and don’t put the settings in the global, but in the included configuration files.

Cluster markers by state on a Leaflet map

As mentioned in my last blog post, I have a little bonus topic to the maps series. In the previous post, we have created a map with Leaflet in JavaScript. The map visualized the capital cities of all German states. Two of them are so close together, that there are hard to click. But how about having a map with all big cities with around 100,000 or more inhabitants:

© ammap.com | SVG map of Germany (low detail), used with Leaflet, modified by Bernhard Kau, CC BY-NC 4.0

Now, especially in North Rhine-Westphalia, it is impossible to see, hover and click all makers. But as we are using Leaflet there is a solution for this:

Use marker cluster

There is an extension for Leaflet called Leaflet.markercluster, which we can use to cluster the markers. In order to use it, we first have to import some more external CSS and JavaScript files:

<link rel="stylesheet"
      href="https://unpkg.com/[email protected]/dist/MarkerCluster.css"
      integrity="sha256-YU3qCpj/P06tdPBJGPax0bm6Q1wltfwjsho5TR4+TYc="
      crossorigin=""/>
<link rel="stylesheet"
      href="https://unpkg.com/[email protected]/dist/MarkerCluster.Default.css"
      integrity="sha256-YSWCMtmNZNwqex4CEw1nQhvFub2lmU7vcCKP+XVwwXA="
      crossorigin=""/>

<script src="https://unpkg.com/[email protected]/dist/leaflet.markercluster.js"
        integrity="sha256-Hk4dIpcqOSb0hZjgyvFOP+cEmDXUKKNE/tT542ZbNQg="
        crossorigin=""></script>

Now we can create a markerClusterGroup and add the markers to this group. At the end, you have to add the marker group to the map:

const markers = L.markerClusterGroup();

cities.map( city => {
    let marker = L.marker( [ city.lat, city.lng ], { title: city.name } );
    marker.on( 'click', function () {
        window.location = city.url;
    } );
    markers.addLayer( marker );
} );

markers.addTo( map );

By default, the markers are clusters with a max radius of 80 pixels. The map of Germany would then look like this:

© ammap.com | SVG map of Germany (low detail), used with Leaflet, modified by Bernhard Kau, CC BY-NC 4.0

While this might be the most efficient clustering, it doesn’t look really nice, as we have multiple clusters in one state and none in others. That’s why I am going to cluster them by state.

Cluster markers by state

We can add multiple markerClusterGroup objects to the map. We create 16 groups for the 16 states and then add the markers to the correct group. Let’s take a look at the complete code:

const stateMarkers = {};

// Get a unique list of all states from the cities array.
[ ...new Set( cities.map( city => city.state ) ) ].map( state => {
    // Create a markerClusterGroup per state.
    stateMarkers[state] = L.markerClusterGroup( {
        maxClusterRadius: 1000,
        spiderfyOnMaxZoom: false,
        showCoverageOnHover: false,
        disableClusteringAtZoom: 8,
    } );
} );

// Create city markers and add them to the correct markerClusterGroup.
cities.map( city => {
    let marker = L.marker( [ city.lat, city.lng ], { title: city.name } );
    marker.on( 'click', function () {
        window.location = city.url;
    } );
    stateMarkers[city.state].addLayer( marker );
} );

// Add all markerClusterGroups to the map.
Object.keys( stateMarkers ).map( state => {
    stateMarkers[state].addTo( map );
} );

First, we create an object for the groups of all states. Then we do some JavaScript magic to get a unique list of all state names from the cities objects and create one marker group. For the cluster groups, we set the maxClusterRadius to 1000 pixels, as our map is smaller than 1000 pixels, which results in cluster groups being at least as big as any state on the map. We also disable two options, we don’t really need. We also define, that on a zoom level of 8, all clusters should be disabled. This will “uncluster” all markers when any of the clusters is clicked.

After we have created the groups, we create and add the city markers to those groups. At the end, we add all groups to the map. This will finally give us the following result (a screenshot):

© ammap.com | SVG map of Germany (low detail), used with Leaflet, modified by Bernhard Kau, CC BY-NC 4.0

Some of the states do not have more than one marker. In this case, they are just shown. All others have a cluster. For North Rhine-Westphalia, we have a cluster of 30 markers. If we click on that cluster, we get the following zoomed view (screenshot):

© ammap.com | SVG map of Germany (low detail), used with Leaflet, modified by Bernhard Kau, zoomed, CC BY-NC 4.0

If your map has more markers, or they are closer, you might have to tweak the options for the cluster groups. For this example, I would say they are now clickable.

Conclusion

This should be the last blog post to my little maps series. There are probably dozens of other possible topics around maps in general and Leaflet, but other blogs and documentation cover them already.

I really hope, that you are curious now to try to create your own (dynamic) maps. And finally, you can also find all examples from this blog post in a single HTML file in a new branch on GitHub.

If you still have topics you want me to cover, please leave a comment.

Use markers on a custom image with Leaflet

In the last two blog posts, we have written some PHP code for geocoding. This week, I want to show you how to do something similar with Leaflet, a well-known JavaScript library you can use to create maps. As it also has the feature to add a custom image layer, we will use it to create a map again.

Getting started with Leaftlet

When using Leaflet, you first have to include some (external) CSS and JavaScript. You can find more details in the quick start guide, but you will basically need the following:

 <link rel="stylesheet" href="https://unpkg.com/[email protected]/dist/leaflet.css"
     integrity="sha256-kLaT2GOSpHechhsozzB+flnD+zUyjE2LlfWPgU04xyI="
     crossorigin=""/>

 <script src="https://unpkg.com/[email protected]/dist/leaflet.js"
     integrity="sha256-WBkoXOwTeyKclOHuWtc+i2uENFpDZ9YPdf5Hf+D7ewM="
     crossorigin=""></script>

<div id="leaflet-map"></div>

Besides the CSS and JS, you would need a container that the map is going to use. You also need some basic styles, but we get to them later.

Setting up the map

As with our previous examples, we have used a map of Germany with a specific size and some boundaries. We also have to define them when using Leaflet:

// Create the map object.
const map = L.map( 'leaflet-map', {
    center: [ 51.1642, 10.4541 ],
    maxZoom: 10,
    zoomDelta: 1,
    zoomSnap: 0,
    scrollWheelZoom: false,
    trackResize: true,
    attributionControl: false,
} );

// Define the image overlay and its boundaries.L.marker([52.5162746,13.3777041]).addTo(map);
const imageUrl = './ammap-germany-low.svg';
const imageBounds = [
    [ 55.051693, 5.864765 ],
    [ 47.269299, 15.043380 ],
];

// Add the overlay to the map.
L.imageOverlay( imageUrl, imageBounds ).addTo( map );

// Automatically zoom the map to the boundaries.
map.fitBounds( imageBounds );

We first create a map object with some basic configuration. Then we define the image source and its boundaries in GPS coordinates, before we add it to the map. In the last step, we fit the map into the container.

The container should have a good size to fit the map and its ratio. We just take the SVG image size in our CSS:

#leaflet-map {
    width: 585.506px;
    height: 791.999px;
    background: white;
    max-width: 100%;
    max-height: 100%;
}

It does not have to be this exact, and you can use a container that is larger/smaller than the SVG image as well.

Adding markers to the map

Now that we have the map, who do we add markers to it? Well, since we are using a mapping library, nothing easier than that. For the marker to the Brandenburg Gate, we just need one line:

L.marker([52.5162746,13.3777041]).addTo(map);

That’s really it! No more transformation from GPS to pixel coordinates. This is all done by Leaflet. You will get the following result:

© ammap.com | SVG map of Germany (low detail), used with Leaflet, modified by Bernhard Kau, CC BY-NC 4.0

The only downside is that out of the box, Leaflet only supports the EPSG:3857 projection (Web Mercator). If you need a different projection, there is however a PROJ extension: Proj4Leaflet.

Adding the capitals of all Germany states to the map

Since you probably want to display more than one marker, let’s add some more to the map. I’ve made a list of all capitals of the 16 Germany states for this example:

var capitals = [
    {
        'state': 'BB', 'name': 'Potsdam', 
        'lat': 52.4009309, 'lng': 13.0591397,
        'url': 'https://de.wikipedia.org/wiki/Potsdam'
    },
    {
        'state': 'BE', 'name': 'Berlin', 
        'lat': 52.5170365, 'lng': 13.3888599,
        'url': 'https://de.wikipedia.org/wiki/Berlin'
    },
    {
        'state': 'BW', 'name': 'Stuttgart', 
        'lat': 48.7784485, 'lng': 9.1800132,
        'url': 'https://de.wikipedia.org/wiki/Stuttgart'
    },
    {
        'state': 'BY', 'name': 'München', 
        'lat': 48.1371079, 'lng': 11.5753822,
        'url': 'https://de.wikipedia.org/wiki/München'
    },
    {
        'state': 'HB', 'name': 'Bremen', 
        'lat': 53.0758196, 'lng': 8.8071646,
        'url': 'https://de.wikipedia.org/wiki/Bremen'
    },
    {
        'state': 'HE', 'name': 'Wiesbaden', 
        'lat': 50.0820384, 'lng': 8.2416556,
        'url': 'https://de.wikipedia.org/wiki/Wiesbaden'
    },
    {
        'state': 'HH', 'name': 'Hamburg', 
        'lat': 53.550341, 'lng': 10.000654,
        'url': 'https://de.wikipedia.org/wiki/Hamburg'
    },
    {
        'state': 'MV', 'name': 'Schwerin', 
        'lat': 53.6288297, 'lng': 11.4148038,
        'url': 'https://de.wikipedia.org/wiki/Schwerin'
    },
    {
        'state': 'NI', 'name': 'Hannover', 
        'lat': 52.3744779, 'lng': 52.3744779,
        'url': 'https://de.wikipedia.org/wiki/Hannover'
    },
    {
        'state': 'NW', 'name': 'Düsseldorf', 
        'lat': 51.2254018, 'lng': 6.7763137,
        'url': 'https://de.wikipedia.org/wiki/Düsseldorf'
    },
    {
        'state': 'RP', 'name': 'Mainz', 
        'lat': 50.0012314, 'lng': 8.2762513,
        'url': 'https://de.wikipedia.org/wiki/Mainz'
    },
    {
        'state': 'SH', 'name': 'Kiel', 
        'lat': 54.3227085, 'lng': 10.135555,
        'url': 'https://de.wikipedia.org/wiki/Kiel'
    },
    {
        'state': 'SL', 'name': 'Saarbrücken', 
        'lat': 49.234362, 'lng': 6.996379,
        'url': 'https://de.wikipedia.org/wiki/Saarbrücken'
    },
    {
        'state': 'SN', 'name': 'Dresden', 
        'lat': 51.0493286, 'lng': 13.7381437,
        'url': 'https://de.wikipedia.org/wiki/Dresden'
    },
    {
        'state': 'ST', 'name': 'Magdeburg', 
        'lat': 52.1315889, 'lng': 11.6399609,
        'url': 'https://de.wikipedia.org/wiki/Magdeburg'
    },
    {
        'state': 'TH', 'name': 'Erfurt', 
        'lat': 50.9777974, 'lng': 11.0287364,
        'url': 'https://de.wikipedia.org/wiki/Erfurt'
    },
];

Similar to the examples in the other two blog posts, we would also like to link the markers to a page. In this case, I just took the German Wikipedia pages for all of them. A marker can get several event handlers. We use the onclick here. Adding all markers from the list can be done with this code:

capitals.map( city => {
    let marker = L.marker( [ city.lat, city.lng ], { title: city.name } );
    marker.on( 'click', function () {
        window.location = city.url;
    } );
    marker.addTo( map );
} );

This will get us the following result (when hovering over the markers, you would also see the city’s name as a title):

© ammap.com | SVG map of Germany (low detail), used with Leaflet, modified by Bernhard Kau, CC BY-NC 4.0

By default, we can zoom into the map, but also out. This is not really ideal for an image overlay. Also, when zooming out, we want to center our map into the container again. This can both be solved with the following code, I have used for the map:

// Set the current min zoom to the zoom level after init.
map.setMinZoom( map.getZoom() );

// Re-center the map when zoomed to minZoom level.
map.on( 'zoomend', function () {
    if ( map.getZoom() === map.getMinZoom() ) {
        map.fitBounds( imageBounds );
    }
} );

Conclusion

In the last three blog posts, you have learned how you can use your own images to create your own individual maps. If you just need a static map, then the PHP approach might be best for you. If you need an interactive map with some features you know from Google Maps (like zooming, etc.), you might want to use Leaflet.

If you want to test the code yourself, you can again find a working version in a new branch on GitHub. I’ve combined everything in a single HTML file, but in a WordPress plugin/theme you can also split them to different files.

I still have an idea for a little “bonus blog post” in this series, so you might get another topic on interactive and individual map. ☺️

Adding markers to a satellite image

In the previous blog posts, I have shown you how to add a marker for a GPS coordinate to an SVG image. In this case, we calculated the x/y pixel position and have drawn an SVG circle or marker path. But what can we do if we have a satellite image – or any other pixel graphic?

Solution: use an SVG as well 😉

OK, not just any SVG. The technique we are using here could be called “a modern image map”. Those of you who are building websites a bit longer probably still know the <map> element which could be used to make an <area> of an <img> tag clickable. The shapes for such an image map however were quite limited and not as flexible and precise as SVG paths. So instead of using a traditional image map, we use an (empty) SVG and place it over an image to create a “clickable map”. Well, we actually just create a clickable SVG overlay, but this will get us the result we want to have. For this blog post, we are using the following satellite image of Berlin:

NASA Goddard Space Flight Center from Greenbelt, MD, USA, Berlin, Germany – Flickr – NASA Goddard Photo and Video1CC BY 2.0

Getting the image boundaries

As explained in the previous blog post, we need to define the boundaries of the map we want to add markers to. We start again by defining the boundaries of the image itself, which is the pixel size:

// Init PixelGeocoder using WGS84 and Mercato projection.
$pixel_geocoder = new PixelGeocoder( 'EPSG:4326', 'EPSG:3857' );
// Set boundaries for the map.
$pixel_geocoder->image_boundaries = [
	'xmin' => 0,
	'xmax' => 2400,
	'ymin' => 0,
	'ymax' => 1800,
];

Now we need the GPS boundaries. For this image, we don’t have them. In order to get them, I searched for spots on the edge of the map I could identify on Google Maps and then got their position. These are the ones I have chosen and added as reference points:

$map_edges = [
	[ 13.0467623, 52.5594922 ], // West.
	[ 13.1993623, 52.6484712 ], // North.
	[ 13.5841963, 52.4416892 ], // East.
	[ 13.2766553, 52.4069153 ], // South.
];

$pixel_geocoder->setDstBoundaries(
	$map_edges,
	false,
	true
);

Now that we have the boundaries, we can calculate the coordinates for the Brandenburg Gate again:

// Calculate the coordinates.
$bb_gate_lat     = 13.3777041;
$bb_gate_lng     = 52.5162746;
$bb_gate_dst_arr = $pixel_geocoder->transformGPStoMapProjection( $bb_gate_lat, $bb_gate_lng );
$bb_gate_coords  = $pixel_geocoder->calculateCoordinatesToPixel( $bb_gate_dst_arr[0], $bb_gate_dst_arr[1] );

var_dump( bb_gate_coords );
/**
 * array(2) {
 *   [0]=>
 *   float(1477.8750879177708)
 *   [1]=>
 *   float(986.3143837577029)
 * }
 */

But how do we now get a marker as an overlay of the satellite image? This is where the SVG image map comes into play.

Generate the SVG image map

An SVG image map is just an empty “SVG canvas” you would place things. We define a single SVG tag with the same width and height as our satellite image. The image itself would just be a sibling node. We wrap both in a container element to add some styles:

<div class="image-map">
	<img class="image-map-background" src="./Berlin-Germany-Flickr-NASA-Goddard-Photo-and-Video1.jpg" alt="Berlin NASA image"/>
	<svg xmlns="http://www.w3.org/2000/svg" xmlns:xlink="http://www.w3.org/1999/xlink" class="dynamic-map" width="2400" height="1800" viewBox="0 0 2400 1800"></svg>
</div>

To place the SVG over the image, we define a fixed with and height for the container element (this should have the same “aspect ratio” as the image):

.image-map {
	position: relative;
	width: 600px;
	height: 450px;
}

.image-map-background,
.dynamic-map {
	max-width: 100%;
	height: auto;
}

.dynamic-map {
	position: absolute;
	top: 0;
	left: 0;
}

Now we can add our markers. I would usually do that by getting a list of the markers either from a static array or using a WP_Query and some meta fields. Let’s take this static array with our single marker as an example:

$markers = [
	[
		'name'  => 'brandenburg-gate',
		'title' => 'Brandenburg Gate',
		'x'	 => $bb_gate_coords[0],
		'y'	 => $bb_gate_coords[1],
		'url'   => 'https://en.wikipedia.org/wiki/Brandenburg_Gate',
	]
];

As we are about to print the marker with some SVG paths and links, we can make this easier to read by using a marker template:

$marker_markup = '
	<a xlink:title="%1$s" target="_parent" class="marker" id="%2$s" xlink:href="/%3$s/" transform="translate(%4$s,%5$s)">
		<path fill="#c10926" fill-rule="evenodd" d="m -0.266,-28.261 a 4.504,4.504 0 0 0 3.204,-1.343 4.613,4.613 0 0 0 1.327,-3.242 4.615,4.615 0 0 0 -1.327,-3.244 4.508,4.508 0 0 0 -3.204,-1.343 4.512,4.512 0 0 0 -3.206,1.343 4.619,4.619 0 0 0 -1.327,3.244 c 0,1.215 0.478,2.382 1.327,3.242 a 4.51,4.51 0 0 0 3.206,1.343 m -0.613,27.98 -8.895,-28.49 h 0.013 a 10.555,10.555 0 0 1 -0.818,-4.074 c 0,-2.77 1.086,-5.425 3.02,-7.381 a 10.251,10.251 0 0 1 7.294,-3.056 c 2.735,0 5.358,1.099 7.293,3.056 a 10.502,10.502 0 0 1 3.021,7.38 c 0,1.414 -0.284,2.798 -0.819,4.076 h 0.012 z" clip-rule="evenodd"/>
	</a>';

Now we put it all together inside our SVG in a loop:

<svg xmlns="http://www.w3.org/2000/svg" xmlns:xlink="http://www.w3.org/1999/xlink" class="dynamic-map" width="2400" height="1800" viewBox="0 0 2400 1800">
	<?php foreach ( $markers as $marker ) : ?>
		<?php
		printf(
			$marker_markup,
			$marker['title'],
			$marker['name'],
			$marker['url'],
			$marker['x'],
			$marker['y']
		);
		?>
	<?php endforeach; ?>
</svg>

By using the printf() function, we can put the dynamic parts into the marker template. When you are using this in WordPress, make sure to use the esc_*() escape functions for the dynamic values.

I used the same approach to visualize the “map edges” as a cyan colored circle. The final result will look like this (it’s just a screenshot of the result):

NASA Goddard Space Flight Center from Greenbelt, MD, USA, Berlin, Germany – Flickr – NASA Goddard Photo and Video1, modified by Bernhard Kau, CC BY 2.0

As the marker we have used is pretty small, I have just scaled it up. As the maker scales by its point, this can be done with a single CSS definition:

.marker path {
	transform: scale(5);
}

Conclusion

In a very similar way, we were able to create an SVG image map with some clickable markers on a satellite image. For the image of a city, this can probably be done if any satellite image. For larger regions, you need to find images with the Mercator projection (or any other projection supported by the PROJ library). It took me quite a while to find a CC licensed image for my examples of this blog post.

If you want this code as well, you can find the new branch with all the different parts combined in a new PHP file on GitHub. You will also find the satellite images there.

I hope this showed you another nice way to use an SVG for an individual map. But we have used quite a bit of custom PHP code and an external library to achieve it. In the next (and probably final) blog post of this map series, I will introduce you with a library you might have already used, just not in this way. So gain, stay tuned. The year will end, but calendar week 52 has one more day in 2023! ?

Geo coordinates to pixel positions – build a map with your own images

This blog post will be a start of a little post series. For a project, I recently had to add markers of cities to a map of Germany. I did that manually in the past, but as the maps has grown to 100 markers, I was looking for a way to do that programmatically.

Map projections

Even though some people believe the earth is flat, the earth is round. But it is also not perfectly round. As our monitors are flat (and before that paper maps), there are man different “map projections“. One of the most common ones is the Mercator projection which is used by Google Maps, Bing Maps, OpenStreetMap and many other services. It’s also referred to by identifier EPSG:3857, which we will need a little later.

GPS coordinates

When giving the position of a place on earth, you usually use the World Geodetic System 1984 (WGS 84) with the latitude and longitude values for a specific place. For the Brandenburg Gate in Berlin this might be around 52.5162746 (latitude) and 13.3777041 (longitude). You might have seen coordinates like this before. You might also have seen a location in degrees, minutes and seconds like 52° 30' 58.59" (latitude) and 13° 22' 39.7338" (longitude). But as it’s easier to make calculations with numbers, the first format is easier to continue with.

Getting SVG maps

So now that we have talked a bit about the theory, let’s talk about code. First, you need to find a map. This can be anything, an aerial photo, a satellite image or an image. I like to use SVG images. You can find them on different platforms. Wikipedia is usually a good source, and maps are usually released using a Creative Commons license. We can find a nice map of Germany with borders to all states. Unfortunately, it uses a different projection system. That’s why, for this blog post, I have chosen the free SVG map from amCharts:

Map of Germany
© ammap.com | SVG map of Germany (low detail), code optimized by Bernhard Kau, CC BY-NC 4.0

There are also commercial services and special stock shops for vector maps. Which ever map you use, please make sure to respect the license.

Geocoding markers

We have a map, let’s start to add some markers. As you probably only know the GPS coordinates, we need a way to convert them to “x/y pixel coordinates” on the SVG map. After some research I’ve found the PROJ library and fortunately there is also a PHP variant of PROJ. We can install it using composer:

composer require proj4php/proj4php

Now we have to do some initialize. We have are converting between two projection systems which we have to set up as follow:

require 'vendor/autoload.php';

// Initialize the PROJ library.
$proj = new Proj4php();

// Set the source and destination projection.
$src_projection = new Proj( 'EPSG:4326', $proj );
$dst_projection = new Proj( 'EPSG:3857', $proj );

The EPSG:4326 projection system, our source projection, is the WGS 84 system used for GPS coordinates. The EPSG:3857 on the other hand is a “Spherical Mercator” projection system mentioned above and also for the SVG file we are using here. So the first one is defining coordinates on a “globe” (spherical map) while the second one is defining coordinates on a flat map (in one of the many projection systems).

Now that we have this setup, let’s do the first conversion. We take the GPS coordinates of Berlin, Germany and convert them to the Mercator coordinates:

$src_berlin = new Point( 13.3777041, 52.5162746, $src_projection );
print_r( $src_berlin->toArray() );
/**
 * Array
 * (
 *     [0] => 52.5162746
 *     [1] => 13.3777041
 *     [2] => 0
 * )
 */

$dst_berlin = $proj->transform( $dst_projection, $src_berlin );
print_r( $dst_berlin->toArray() );
/**
 * Array
 * (
 *     [0] => 1489199.2083951
 *     [1] => 6894018.2850289
 *     [2] => 0
 * )
 */

All right, we have some new numbers now. But how would you use them now? If we want to put them on the SVG map, we have to calculate the pixel coordinates on that image.

Getting the image boundaries

Now we need to get the min and max coordinates on the map. If we are lucky, we would get the coordinates of these points from the provider of the map. Unfortunately for the map from Wikipedia there are no such coordinates given. You can probably find those boundaries on with a search engine or use an open API like the one from OpenStreetMaps and other services. But if you don’t have such data or don’t know where to find them, you can just try to get a GPS coordinate for the points on the edges. So for the map of Germany, we would need to find the places all the way in the North, East, South and West. With these points, we then use the min/max values for the latitude and longitude. Fortunately for the amCharts map, they have it in the source code of the SVG itself:

<amcharts:ammap projection="mercator" leftLongitude="5.864765" topLatitude="55.051693" rightLongitude="15.043380" bottomLatitude="47.269299"></amcharts:ammap>

With these, we can just use two reference points (that are not within the country limits of Germany, but that’s not an issue) and do our calculation:

$swap_x = false;
$swap_y = true;

$dst_points_x = [];
$dst_points_y = [];

$src_points = [
	[ 15.043380, 47.269133 ],
	[ 5.865010, 55.057722 ],
];

foreach ( $src_points as $point ) {
	$src_point      = new Point( $point[0], $point[1], $src_projection );
	$dst_point      = $proj->transform( $dst_projection, $src_point );
	$dst_point_arr  = $dst_point->toArray();
	$dst_points_x[] = $dst_point_arr[0];
	$dst_points_y[] = $dst_point_arr[1];
}

$src_boundaries = [
	'xmin' => $swap_x ? max( $dst_points_x ) : min( $dst_points_x ),
	'xmax' => $swap_x ? min( $dst_points_x ) : max( $dst_points_x ),
	'ymin' => $swap_y ? max( $dst_points_y ) : min( $dst_points_y ),
	'ymax' => $swap_y ? min( $dst_points_y ) : max( $dst_points_y ),
];

var_dump( $src_boundaries );
/**
 * array(4) {
 *   ["xmin"]=>
 *   float(653037.4250227585)
 *   ["xmax"]=>
 *   float(1668369.9214457471)
 *   ["ymin"]=>
 *   float(5986273.409259587)
 *   ["ymax"]=>
 *   float(7373214.063855921)
 * }
 */

With the two “swap” flags, you can indicate that the coordinates are on opposite sites of 0° latitude or 0° longitude, so the maximum value would be used for the left boundary for example and the minimum for the right boundary. For Germany, we have to set $swap_y to true.

Now that we have the boundaries, we can calculate the coordinates on the image. We would also need the size of the image. Then the calculation would be like this:

$image_boundaries = [
	'xmin' => 0,
	'xmax' => 585.506,
	'ymin' => 0,
	'ymax' => 791.999,
];

$dst_berlin_arr = $dst_berlin->toArray();
$lng = $dst_berlin_arr[0];
$lat = $dst_berlin_arr[1];

$x_pos = ( $lng - $src_boundaries['xmin'] ) / ( $src_boundaries['xmax'] - $src_boundaries['xmin'] ) * ( $image_boundaries['xmax'] - $image_boundaries['xmin'] );

$y_pos = ( $lat - $src_boundaries['ymin'] ) / ( $src_boundaries['ymax'] - $src_boundaries['ymin'] ) * ( $image_boundaries['ymax'] - $image_boundaries['ymin'] );

var_dump( [ $x_pos, $y_pos ] );
/**
 * array(2) {
 *   [0]=>
 *   float(487.1242093149932)
 *   [1]=>
 *   float(523.9253760603847)
 * }
 */

First, we define the boundaries of our SVG map of Germany. Then we use the $dst_berlin point we have transformed before and put it into our calculation. By using $src_boundaries['xmax'] - $src_boundaries['xmin'] we get the “width” of the source projection boundaries (same for the image boundaries). We then subtract the left boundary from the longitude of the point. We divide this point by the width of the source projection and multiply it with the width of the destination projection. This will give us the pixel position on the image. We do the same for the y-axis. To visualize the point, we could simply draw a SVG circle. This would then look like this in code:

<circle cx="482.18464676347816" cy="273.64009871474894" r="5" stroke="red" stroke-width="2" fill="transparent" />

We then add this new node to the original SVG map and get the following:

Map of Germany with a circle on Berlin
© ammap.com | SVG map of Germany (low detail), code optimized and modified by Bernhard Kau, CC BY-NC 4.0

Putting it all together

In order to make this all a little easier, I’ve written a small PixelGeocoder class with the initialization steps, the helper function for the boundaries and a method to do get the coordinates for the image:

use proj4php\Proj4php;
use proj4php\Proj;
use proj4php\Point;

class PixelGeocoder {
	public $proj;
	public $src_proj;
	public $dst_proj;

	public $src_boundaries = [
		'xmin' => 0,
		'xmax' => 0,
		'ymin' => 0,
		'ymax' => 0,
	];

	public $image_boundaries = [
		'xmin' => 0,
		'xmax' => 0,
		'ymin' => 0,
		'ymax' => 0,
	];

	public function __construct( $src_proj_type = 'EPSG:4326', $dst_proj_type = 'EPSG:3857' ) {
		$this->proj     = new Proj4php();
		$this->src_proj = new Proj( $src_proj_type, $this->proj );
		$this->dst_proj = new Proj( $dst_proj_type, $this->proj );
	}

	public function setDstBoundaries( $points, $swap_x = false, $swap_y = false ) {
		$dst_points_x = [];
		$dst_points_y = [];

		foreach ( $points as $point ) {
			$dst_point      = $this->transformGPStoMapProjection( $point[0], $point[1] );
			$dst_points_x[] = $dst_point[0];
			$dst_points_y[] = $dst_point[1];
		}

		$this->src_boundaries = [
			'xmin' => $swap_x ? max( $dst_points_x ) : min( $dst_points_x ),
			'xmax' => $swap_x ? min( $dst_points_x ) : max( $dst_points_x ),
			'ymin' => $swap_y ? max( $dst_points_y ) : min( $dst_points_y ),
			'ymax' => $swap_y ? min( $dst_points_y ) : max( $dst_points_y ),
		];
	}

	public function transformGPStoMapProjection( $lng, $lat ) {
		$src_point = new Point( $lng, $lat, $this->src_proj );
		$dst_point = $this->proj->transform( $this->dst_proj, $src_point );

		return $dst_point->toArray();
	}

	public function calculateCoordinatesToPixel( $lng, $lat ) {
		return [
			( $lng - $this->src_boundaries['xmin'] ) / ( $this->src_boundaries['xmax'] - $this->src_boundaries['xmin'] ) * ( $this->image_boundaries['xmax'] - $this->image_boundaries['xmin'] ),
			( $lat - $this->src_boundaries['ymin'] ) / ( $this->src_boundaries['ymax'] - $this->src_boundaries['ymin'] ) * ( $this->image_boundaries['ymax'] - $this->image_boundaries['ymin'] ),
		];
	}
}

Now if you want to use this class, this is:

require_once 'vendor/autoload.php';
require_once 'PixelGeocoder.php';

// Init PixelGeocoder using WGS84 and Mercato projection.
$pixel_geocoder = new PixelGeocoder( 'EPSG:4326', 'EPSG:3857' );
// Set boundaries for the map.
$pixel_geocoder->image_boundaries = [
	'xmin' => 0,
	'xmax' => 585.506,
	'ymin' => 0,
	'ymax' => 791.999,
];
$pixel_geocoder->setDstBoundaries(
	[
		[ 15.043380, 47.269133 ],
		[ 5.865010, 55.057722 ],
	],
	false,
	true
);

// Calculate the coordinates.
$berlin_lat     = 13.3777041;
$berlin_lng     = 52.5162746;
$dst_berlin_arr = $pixel_geocoder->transformGPStoMapProjection( $berlin_lat, $berlin_lng );
$image_coords   = $pixel_geocoder->calculateCoordinatesToPixel( $dst_berlin_arr[0], $dst_berlin_arr[1] );

var_dump( $image_coords );
/**
 * array(2) {
 *   [0]=>
 *   float(479.2493080704524)
 *   [1]=>
 *   float(273.55748351793665)
 * }
 */

Bonus: use a clickable marker

The circle is easy and nice, but if you want to build a map, you probably want to use a marker, and it should be clickable. Since we are using an SVG image here, we can use a path for the marker and then move it around with the transform="translate(x,y)" attribute:

<a xlink:title="Link to berlin.de" target="_parent" xlink:href="https://berlin.de/" transform="translate(479.2493080704524,273.55748351793665)">
	<path fill="#c10926" fill-rule="evenodd" d="m -0.266,-28.261 a 4.504,4.504 0 0 0 3.204,-1.343 4.613,4.613 0 0 0 1.327,-3.242 4.615,4.615 0 0 0 -1.327,-3.244 4.508,4.508 0 0 0 -3.204,-1.343 4.512,4.512 0 0 0 -3.206,1.343 4.619,4.619 0 0 0 -1.327,3.244 c 0,1.215 0.478,2.382 1.327,3.242 a 4.51,4.51 0 0 0 3.206,1.343 m -0.613,27.98 -8.895,-28.49 h 0.013 a 10.555,10.555 0 0 1 -0.818,-4.074 c 0,-2.77 1.086,-5.425 3.02,-7.381 a 10.251,10.251 0 0 1 7.294,-3.056 c 2.735,0 5.358,1.099 7.293,3.056 a 10.502,10.502 0 0 1 3.021,7.38 c 0,1.414 -0.284,2.798 -0.819,4.076 h 0.012 z" clip-rule="evenodd"/>
</a>

When added to our map, the result would look like this:

Map of Germany with a clickable marker on Berlin
© ammap.com | SVG map of Germany (low detail), code optimized and modified by Bernhard Kau, CC BY-NC 4.0

Conclusion

We all love map, don’t we? But sometimes a Google Maps or OpenStreetMap version just doesn’t look nice. With some custom code and a little set-up work, we can create beautiful maps on top of (our own) images. I did the above for a map of Germany that would get the GPS coordinates from a WordPress custom post type and then dynamically created the SVG markup for the city markers in a shortcode (and later server-side-rendered block).

If you want to test the code yourself, you can find it all on GitHub. It is a “proof of concept” and works, but the PHP class can probably use a better architecture and maybe some more methods, so please feel free to adjust it to your need.

In my next blog post, I will show you how you use a picture instead of an SVG map, so stay tuned, the year is not over, yet! ?

Fatal errors on WordPress with PHP 8+ and an incorrect translation

Last week, I got a report about a broken site, that caught me a bit by surprise. I’ll recreate the issue with a dummy plugin here, so show what went wrong. When navigating to the page with the error, this message was presented to me:

Fatal error: Uncaught Error: Missing format specifier at end of string
in /var/www/html/wp-content/plugins/broken-format-string/broken-format-string.php on line 15

I looked at the code and saw something like:

printf(
	__( 'Publish date: %s', 'broken-format-string' ),
	date_i18n( get_option( 'date_format' ), get_post_datetime() )
);

Nothing fancy so far. Just a format string with a placeholder for a string, that gets replaced with the post date in the WordPress date format.

Incorrect translation

As I couldn’t see any issue here, I was first a bit confused, what the issue would be. But since the website language was not set to “English (US)”, I’ve checked the translation file. Again, here is an example of a translation with a similar issue:

#: broken-format-string.php:14
msgid "Publish date: %s"
msgstr "Veröffentlichungsdatum: %"

This German translation is translating the “Publish date:” part, but as the placeholder, it is only using a % instead of a %s and this causes the issue. WordPress would translate the original string to German and then pass it to the printf() function, which then exists with a “Fatal error”.

Different error handing with PHP 8+

When you run this code with PHP 7.4 and earlier, you don’t get a fatal error. You don’t even get a PHP notice or warning. It would just not replace the placeholder correctly. The % would just be replaced with an empty string. But as soon as you upgrade to PHP 8+ you will have a broken site.

This was one of the first real issues I have recognized with PHP 8+ on a WordPress site. Maybe I was just lucky, or translation always had all the placeholders translated correctly.

Conclusion

I’ve done some checks for PHP 8+ compatibility with the PHPCompatibilityWP and so far it never failed me. But I would never have imagined, that an incorrect translation would cause a fatal error. When translations are made with GlotPress (used on translate.wordpress.org), you will see a warning, that the translation is missing a placeholder. But tools like Poedit don’t show such a warning. So when you have someone translating a plugin/theme into a language you don’t speak, better make sure that format strings are correct.

The “text-underline-offset” and other lesser known CSS properties for links

Working for a larger agency has many benefits. One of them is that you work with people, that know a lot more about many things then you do. I usually read commits from my colleagues to see how they do things. In one commit, I saw a CSS property I have never seen before: text-underline-offset ?

Styling links

In the early days of the World Wide Web, all links were underlined. With the rise of CSS and more modern designs, people wanted to have different styles for links. As the color and position of the text-decoration: underline was dictated by the used font and its color, it was often replaced with a border-bottom. This whoever caused many different issues, including in many cases a decreased accessibility of the links. With modern CSS there are now many different CSS properties you can use to style links … and which I have never heard of:

On the linked MDN Web Docs pages, you can try many of these properties yourself. I could probably find many very use-case for those properties and show you how they would look like, but I don’t want to spoiler it for you ?

Conclusion

When developing websites, one thing is always true: you can’t know everything. This is why I can highly recommend reading code from other people and get expired from their works. While these CSS properties might be already familiar to you, they totally blew my mind!

Create a dynamic iCalendar with blog posts

A small local website used a booking calendar plugin. Those bookings were then copied manually to an online calendar, where the team would have an overview on the bookings. Unfortunately, the booking calendar plugin didn’t have any feature to dynamically show the booking on a calendar app. So I was asked if I could help here. To make this a little more useful for some of you, instead of creating a calendar with entries for this specific booking calendar plugin, I’ll show you how to use the same approach to display all your published and scheduled blog posts.

Installing the dependency

We are going to create a dynamic .ical file. This is a text file, and we could just create the “code” ourselves, we are going to use a library to help us with that task. For the project, I have used the spatie/icalendar-generator library, which has everything I needed (and a lot more). We install it using composer into our plugin folder:

composer require spatie/icalendar-generator

We then have to load the necessary files. The easiest way to do this with packages installed with composer is using the composer autoloader, which we just have to require in our main plugin PHP file:

require_once 'vendor/autoload.php';

Creating a calendar

Now we can start to dynamically create our calendar. I will use the most basic code examples here, but in the documentation of the package you can find more complex examples. So let’s create the $calendar object first:

$calendar = Calendar::create( 'example.com' );

The parameter of the create() function is used as the title, but you can also leave it empty. Once the $calendar object is created, we would query our data for the events. Here we just query for the lasted published and scheduled blog posts:

// Get all blog posts.
$query_args = [
	'post_type'      => 'post',
	'post_status'    => [
		'publish',
		'future',
	],
	'posts_per_page' => - 1,
];

$posts = get_posts( $query_args );

Now that we have our blog posts, we can create individual calendar events for all of them:

// Create an event per blog post.
foreach ( $posts as $post ) {
	$start_date = new DateTime( $post->post_date_gmt, new DateTimeZone( 'UTC' ) );
	$end_date   = ( clone $start_date )->add( new DateInterval( 'PT15M' ) );

	$event = Event::create();
	$event->name( $post->post_title );
	$event->startsAt( $start_date );
	$event->endsAt( $end_date );
	$event->uniqueIdentifier( $post->ID );

	$calendar->event( $event );
}

We are using the GMT/UTC times, so the calendar events can adapt to your local time zone. For the “end date”, we just add 15 minutes. By using the post ID as the unique identifier, we make it easier for calendar applications to update/synchronize the event. Finally, we add the event to the previously created $calendar object.

The last step if sending the output. This can be done with the following lines:

// Print the calendar output.
header( 'Content-Type: text/calendar; charset=utf-8' );
echo $calendar->get();
exit;

Import the iCalendar into your calendar app

Now that we can dynamically create the calendar, we probably want to import (and sync) it into a calendar app. For this, we would need to have a URL we can put into the app. I’ve decided to use a custom REST endpoint, so I’ve wrapped everything in a callback function and registered the endpoint like this:

function blog_posts_calendar_register_rest_route() {
	register_rest_route(
		'blog-posts-calendar/v1',
		'/ical.ics',
		[
			'methods'             => 'GET',
			'callback'            => 'blog_posts_calendar_generate_ical',
			'permission_callback' => '__return_true',
		]
	);
}
add_action( 'rest_api_init', 'blog_posts_calendar_register_rest_route' );

The calendar can then be accessed using this URL: https://example.com/wp-json/blog-posts-calendar/v1/ical.ics

The permission_callback would allow anyone to subscribe to this calendar. If you want to restrict it, you can implement our own login in your own callback here.

Conclusion

Even if a plugin does not offer some features you might need, you can often write some own custom code to make this available. This is usually a lot easier than replacing the whole plugin, which then might lack some other features. In the case of a booking plugin, it would probably also be quite challenging to migrate all the bookings to another plugin.

If you want to test this code on your website, you can find it as a plugin on GitHub.