Some weeks ago, I was asked how a user with the “Editor” role can change the content of the privacy page. If you use the “Settings > Privacy > Select a Privacy Policy page” settings and pick a page here, this page can only be edited by users with the “Administrator” role. To allow editors updating this page, there are several strategies.
Option 1: Make the page a normal page
If you do not set the page in “Settings > Privacy > Select a Privacy Policy page”, an editor user is able to edit the content, since it’s only a normal page. But this setting has some meaning. A link to this page is automatically shown below the form on the wp-login.php page. It can also be added to the navigation in a theme using the function the_privacy_policy_link(), which some older default themes (Twenty Fourteen – Twenty Twenty-One) do.
If you use this option, it usually makes sense to only make this a normal page while an editor is updating the page and set it as the privacy policy page again, once the updates are made.
Option 2: Allow editors to “manage_options”
WordPress has all kinds of so-called “capabilities” to give users (and user roles) the rights to do specific things. One newer capability is named manage_privacy_options and it sounds like the one we would need to give editors (or single users) to be able to edit the privacy policy page, right? Unfortunately, that’s not the case. This capability is more like a “meta capability”, since when this capability is assigned to a user or role, the user needs the manage_options capability to be able to edit the privacy policy page. But with this role, you would also allow them to change (almost) all settings of your website. That is probably too much power and responsibility for editors.
Option 3: Use some special roles from SEO plugins
I mainly use Yoast SEO for my site, and it comes with two additional roles: “SEO Editor” and “SEO Manager”. While both get all the capabilities from the “Editor” role, they do get some extra capabilities for the Yoast SEO plugin. And the “SEO Manager” also get the capability to edit the privacy page.
Other SEO plugins might have similar roles, but I have not checked them. If the plugin you are using does have such a role or a setting to allow editors to edit the privacy policy page, please leave a comment with the plugin name on how it works.
Option 4: Use a code snippet to allow the editing of the page
I came up with a tiny code snippet that would allow editors to update the privacy policy page, without giving them too many other capabilities they don’t need. The snippet basically filters the check for the manage_privacy_options capability, and then remove the requirement for the manage_options capability from the list. This is the code of the snippet:
Yoast SEO is using a very similar snippet, but with a little more complexity, since they check for their own “SEO Manager” role.
Conclusion
I can see why WordPress Core developers limited the capability to edit the privacy policy page to a smaller group of users. In a ticket on that matter, they were discussing that editors might not be “trained in privacy law or organizational policies”, required to write correct content into that page. But why would any user with the “Administrator” role be necessarily trained to do that? But only those users can update the page, which can also cause some legal risks, if that blocks a frequent update to that page.
Today, I have a different blog post for you. Not only is the topic a bit different, this blog post will also be the first one that comes in two formats. I’ve been blogging text-only for more than 16 years now. I also often send links to my blog posts to friends and colleagues, when they run into topics, I have covered. But sometimes I realize, that it’s not easy, to only write about them. For some topics, a video just is easier to understand.
So with this blog post, you will have the chance to either read about the topic, or watch a video instead. Or just do both, and tell me what worked better for you. Now, let’s jump into the topic.
Finding a contact to delete
A friend is using Mailchimp for her newsletter for many years. Sometimes, she would get fake sign-ups she wants to delete. She struggled multiple times to delete them, since Mailchimp makes it a little harder than necessary.
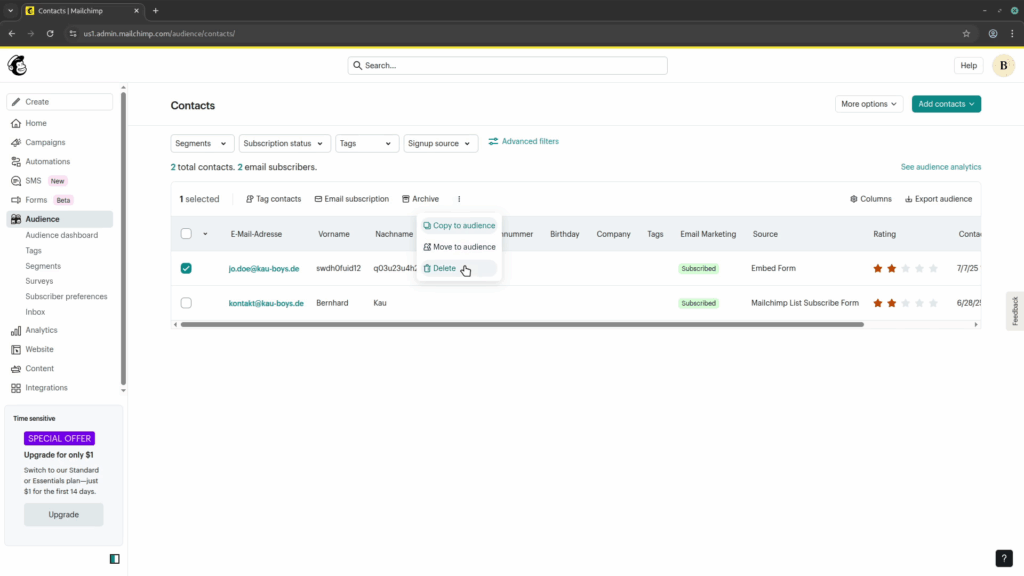
After you have logged into your Mailchimp account, navigate to “Audience” and select the contacts you want to delete. Then you hover over the three dots right of the “Archive” button and then select “Delete” from the drop-down:
Archiving or deleting a contact?
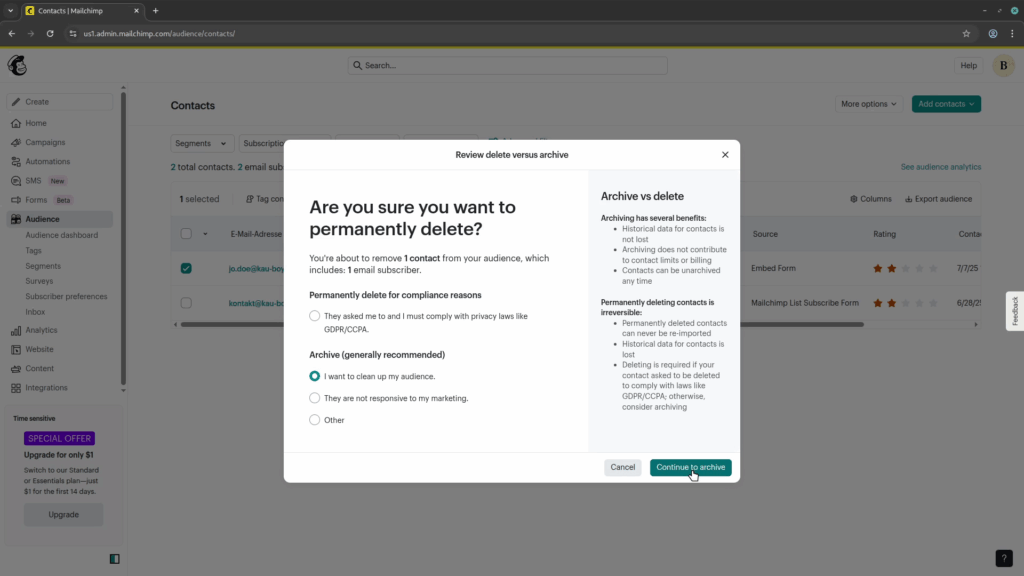
This opens a modal, and here it is a bit confusing. It asks: “Are you sure you want to permanently delete?” you contact. For the option that would do that, the selection is labeled “They asked me to and I must compy with privacy laws like the GDPR/CCPA”, which might not be the case for you. If you only want to remove the contact for other reasons, you might choose “I want to clean up my audience” instead, and then click on “Continue to archive”:
The confusing archive dialog
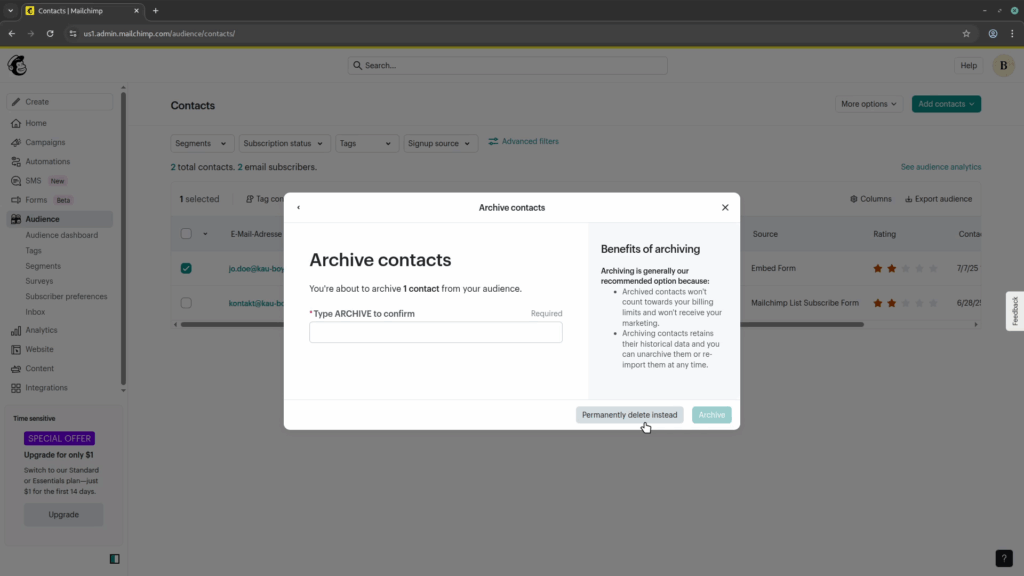
As you actually wanted to delete the contact, you now get the “Archive contacts”, which is not what you want. To get to the dialog you need, click on the gray “Permanently delete instead” button in the bottom right:
Deleting the contact, finally!
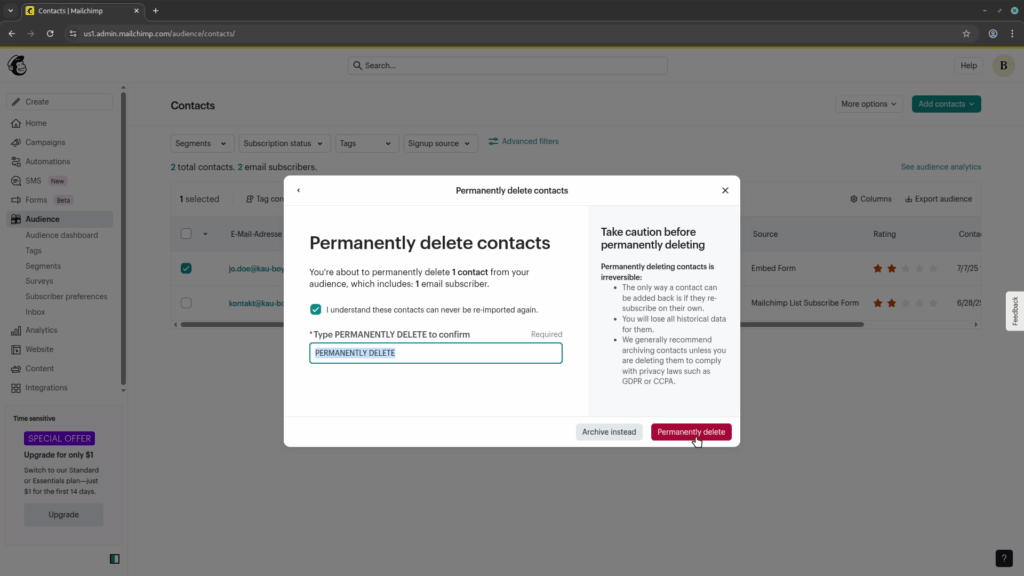
When you made it this far, either directly, or “through the wrong dialog”, you now have to face the biggest challenge of all. You have to type “PERMANENTLY DELETE” into the input field. If you are lazy, like I am, you can also select the text and drag-and-drop it into the input. This finally activates the red “Permanently delete” button and after clicking it, the contact is gone.
You prefer a video tutorial? Here you go!
As mentioned before, this is the first blog post that is also available as a video. You can watch it on YouTube. Even though I’m a big fan of “owning your content”, I also have to be realistic that videos are easier to find on streaming platforms.
Since this is my first video, I’d highly appreciate it if you would watch it and give me some feedback. It’s really short and tries to explain only the necessary bits, without a large introduction. If you are willing to subscribe to my new channel, that would also be great and help me get some more visibility. But now you can watch the video here, or on YouTube:
What did you find better? Was the text plus images explanation good enough? Or do you prefer such content in video format, so you can follow the clicks you have to make more easily?
The screenshots in this blog post have all been taken from the video file, so they match what you would see in the video.
For comments on your preferred format, please post them under this blog post. For general feedback on the video, comment on YouTube instead.
Two weeks ago, I wrote the blog post celebrating 16 years of working with and blogging about WordPress. You’d think that after such a long time, you have seen everything in WordPress, especially all the “old stuff”. But you have no idea how much there is!
This week, I’ve found some piece of code, that really surprised me. I wanted to cover that in a blog post, but forgot to write it down. Trying to find that code again, I found something even more mind-blowing, which I want to cover today.
The trash as a “safe place”
We all do that. We write some content, are not happy with it, and move it to the trash. Most desktop operating system have a trash as well. Mine has currently only three file in it, all deleted in the last two weeks. But when I was using Windows as my daily OS, I may have hundreds of files in it, sometimes wasting several GB of storage. It was often safe to just empty the trash, but in some cases, you would find files, you didn’t want to delete in the first place. So it was reassuring to know, that the trash in Windows (and many other systems as well), does not get deleted automatically. That’s not the case in WordPress! 😮
Trashing things in WordPress
There are two things you can trash: posts/pages (and other post types) and comments. But did you know that they get deleted after 30 days? I did not know that!
The EMPTY_TRASH_DAYS constant
When trying to find the code for this other topic, I found the EMPTY_TRASH_DAYS by accident. It has a default value of 30, which means that any post or comment, that has been trashed at least 30 days earlier, will be deleted. This is done by the wp_scheduled_delete WP-Cron event, that runs daily.
When you set the constant to 0 (or another “falsy” value), you basically disable the trash altogether, and all “Trash” links in the backend will become “Delete Permanently” links.
When you trash a post or comment, WordPress will add two meta values _wp_trash_meta_time, with a timestamp on when the entry was trashed and _wp_trash_meta_status, reflecting the previous post or comment status, since they change to trash, and WordPress will restore the previous status, if you restore an entry from the trash.
Conclusion
If you are using your trash to “move things out of sight”, be aware, that they will be deleted after 30 days. If you want to extend that time, simply define the EMPTY_TRASH_DAYS constant in your wp-config.php with a (much) higher values.
Have you known this constant before reading this blog post? Have you ever used it, and if so, have you increased or decreased the time, or rather used it to disable the trash completely?
For some of us, our 16th birthday was something special. In Germany, you could go to movies rated 16+ and be alone in the cinema until midnight. Others fulfilled their dream of getting a motorcycle license. In the US, you can even get a driver’s license for a car. My blog also turns 16 today and a new chapter begins.
Closure of more plugins in prospect
Last year, I had hoped that I would finally be able to close the Language Fallback plugin. But unfortunately, Preferred Languages has not landed in the Core. However, the now longer release cycles will bring some movement into the matter, as the plugin now has a good chance of finally being included in one of the next major versions. Important preliminary work for the necessary performance optimization has already been implemented in WordPress 6.5 into Core.
At WordCamp Leipzig, I also learned that an interface for my Embeds for ProvenExpert plugin will soon no longer be available. But I’m not too sad about that, because there is now an official plugin from ProvenExpert that also implements blocks. Mine currently only offers widgets, and I save myself the work on the branch that implements the blocks. However, I will of course try to implement a “migration path” for all those who are currently still using my plugin so that they can switch over without any problems.
The numbers for the past year
Visits to the English blog have increased by around 12%, but for the German blog, they have dropped by 23.1%, which I’d assume is also caused by the rise of AI, which presents answers without the need to visit the site. Looking at the Google Search Console, clicks have increased by around 43% and impressions by around 76%. The numbers for the German site are also positive, but not this high.
One interesting metric is the “visit duration”, which increased by 240% for English and 300% for German! So while AI might have caused a drop in overall traffic, the “traffic quality” has increased, and visitors read much longer, once they clicked a link. As I’m not pursuing a commercial purpose with the site, the numbers aren’t that important to me. I’m just happy when I can help others, and especially when someone leaves me a comment. Unfortunately, there were only 7 comments, 2 of them from me. You are all welcome to change that directly under this post. 😉
If you want to see more stats for the German blog, you can find them on the translated post – which you might just translate to English, using AI, if you don’t speak German. 😀
The previous top post dropped to the third place. The new two top posts were both written in 2023 and climbed all the way to the top.
When you check the Top3 for German, you will find different topics. The one about how to debug errors in Contact Form 7 was not yet translated into English. But since it was so successful, I did that at the end of last year. I also took the opportunity to test the content again with the current version of WordPress and Contact Form 7 and updated all the screenshots. There is also another piece of news concerning this post, but more on that in a moment.
Classic Themes will still work in 2025
Just 12 months ago, I was optimistic that my project to reimplement the current theme as a block theme would be successful. But less than 2 weeks later, I had to admit to myself that the goal was not achievable in the desired way. In November, I abandoned the project for the time being. In the four months between these two posts, I also invested a lot of time in the theme and had to neglect blogging.
I still plan to replace the current theme, but no longer with the same goal. I will accompany the new attempt with posts again, but perhaps in a different way.
New project: supplementary videos for the blog
I have often faced the problem, that I want to write a blog post on a topic, but found it very difficult to write it in text, code examples and images. Some things are just too complex to explain them well enough in this form, especially when you need a lot of steps and don’t necessarily want to have 20 screenshots of every single one of these steps. That’s why I would like to take on the project of explaining such topics in a video. I already have a YouTube channel (there is also an English one, but currently without any videos) and have already produced a video as a test. And now we’re coming back to the second-placed German post, because this one is probably a good example of a blog post, to record a video for. As soon as it is finished, I will present it in a separate post and probably include it in the original post.
Conclusion
I was able to achieve some goals, but failed on others. I only managed my 26 posts through the Advent calendar in December, but I still really enjoy sharing new posts with you. If the videos work well, you can look forward to completely new topics in the future that I haven’t tried to tackle yet as blog posts.
Of course, there has to be a video at the end. Last year I shared the WordCamp Europe announcement with you, but of course it makes more sense to present my first (German) YouTube video here. Maybe you’d like to do me a favor and subscribe to the channel (or the English one). That might motivate me a bit more to record the next video even faster, or translate the current one. I haven’t tested these “AI video translations with your voice in a different language”, but maybe you can give it a try and tell me how it sounds in English (or you native language). 😉
Some of you might know, that I grew up in Mannheim, where I’ve lived for 26 years, before moving to Berlin. On the way to this year’s WordCamp Europe, I’ve spent some days in Mannheim, before taking a train to Basel, Switzerland. After only 121 minutes, we arrived – on time – in Basel. Taking the tram to our accommodation for the next days, we’ve realized what an absolutely beautiful city Basel is! How can I have lived so close to such a city for so many years and never visited it?
Some sightseeing and museums
As we’ve arrived on Tuesdays, and the Contributor Day would only start on Thursday, we had some time to explore the city. When you book the accommodation in Basel, you get the “Basel Card”, which gives you free public transport and discounts in many museums and other places. We’ve used it quite intensively, but Basel is also quite good to explore by just walking.
Our accommodation was next to “Marktplatz” (market square), so we started there and briefly went into the town hall courtyard. We continued walking through some old streets and took the chance to buy some nice things. Next, we went to the “Carnival Fountain” from Swiss artist Jean Tinguely. Different sculptures were moving and spilling water around. A very different and fascinating fountain. We liked it so much that we decided to visit the Tinguely museum the next day. But first we continued to the Basler Münster (Basel Minster), a cathedral from the 11th century. Behind the cathedral, we found a very unique type of transportation, we had to take: a “wooden ferry”, that does not need any “power” to cross the river. It would just steer around 45° into the flow of the Rhine river to make it to the other side.
The next day was rainy, as most days this week, and we only went to the Tinguely museum, which really had some very cool sculptures. In order to not wear the mechanics out too fast, you could only activate them every 9 minutes manually by pressing a button. In the evening, we had a nice team dinner with my colleagues from Syde.
Contributor Day
Like on previous flagship WordCamp events, I’ve volunteered to be a Table Lead at the Contributor Day for the Meta Team. Even though only one contributor joined my table, we had some great outcome. Xaver worked on a cool new feature, that would allow WordCamp organizers to check in attendees much faster, by scanning a QR code to find them in the list and mark them as attended.
As always, the Contributor Day is over much faster than you think. The evening was dedicated for “The Social”, the invite only event for all organizers, volunteers, sponsors and all other people making WordCamp Europe happen.
The first conference day
Syde had a booth in the sponsors area, but I did not have any “booth duties”, so I could take the chance to see some talks and talk to people.
WordPress without Borders — The Fight for Digital Freedom
After the opening remarks, I’ve stayed for the first talk, a keynote from Noel Tock. He shared some stats on WordPress and how the number of installations have been influenced by events in the past years, like the pandemic. But then he turned it into a presentation on how WordPress does help charities in their work. Since he himself has a charity that rescues dogs in Ukraine, he highlighted some other charities which operate in Ukraine and what they do. A very different and emotional start into WordCamp Europe.
Building Support as core of product
After taking a break and mainly talking to sponsors and attendees, I went back to track 1 for some lightning talks. For the first one, I was a bit late, but still got some cool tips from Anna on how to make support an important part of your company and not only a responsibility of one team.
3 WordPress Agency F*ckups and What I Learned from Them
The second one was a fun one. I had the chance to briefly talk to Jennifer at the Contributor Day about her talk. She told the audience of “nightmares” she experienced in various projects. With many of those, I could relate, since I’ve experienced them myself in the last 10 years working for WordPress agencies.
What we learned from building Site Kit and how you can apply this to your WordPress site
In the last lightning talk of this round, Mariya shared some stories about the Site Kit, the official WordPress plugin from Google, and how the learning from this plugin can help others in their own work. It is always difficult, if not even impossible, to create a plugin that serves everyone.
Connecting cultures at SWI Swissinfo.ch: The journey to international audience engagement
This was the first talk one of my collegues gave. Our Commercial Director at Syde, Ronny Marx, shared the stage with Isabelle Schrills from Swissinfo. They both shared insights on a shared project from the client and agency point of view and highlighted how well a project can turn out if both sides work collaboratively on a new website. Since Swissinfo publishes content in 10 different languages, the use of a WordPress Multisite combined with Syde’s own multilingual plugin solution MultilingualPress fitted perfectly for this type of project, and Isabelle reported, that everyone was really happy with the new system and was not looking back on the legacy one.
WordPress Speed Build
One of my highlights of WordCamp Europe 2024 in Torino was the Speed Build Challenge, hosted by Jamie Marsland. In this editon, Ellen Bauer and Fabian Kägy got a real “challenge”. Jamie presented them with a “fancy” ecommerce side, including some marquees, sliders, playful fonts and other things that were hard to recreate. Fabian managed to get more things done visually, but Ellen even went as far as setting up WooCommerce, so the results was a real shop. The task, however, was not really doable in 30 minutes, but both had great fun and entertained the audience in their attempt to recreate the page.
The second conference day
I’ve initially signed up for my first ever WCEU workshop, but somehow did not receive my confirmation. OK, I was also very late with registering, so it’s my own fault. And as we had to move to a different hotel for the last night, I took it slowly in the morning.
Multilingual WordPress for developers
Another colleague from Syde, Dennis Plöttner, gave a talk in track 2 about multilingual WordPress. This is a topic Dennis cares a lot about, since he also wrote a free plugin to create a multilingual website. Even though I have experience to make WordPress code translatable, I’ve learned some new things from his presentation. Such a topic always gathers a large audience at WordCamp Europe, and especially in a country with four official languages, like Switzerland.
WP Cafe: Five for the Future
After a small break, I joined other attendees to talk about the “Five for the Future” initiative. In light of recent events, there were many things to discuss. Many people shared great ideas, and I am very much looking forward to seeing some momentum in this crucial initiative in our community.
Why Block Themes Make WooCommerce Stores Better
Some of you might know that I don’t like ecommerce. It has nothing to do with WooCommerce or any other solution, I just don’t like the complexity around it and the time it takes me to get into it, when I only have the chance to work on ecommerce projects quite rarely. But I was looking forward to the talk from Ellen. It was packed, and I’ve learned some new things about how blocks can really turn WooCommerce into a new experience for merchants in the future. She was also presenting some first bits of a new WooCommerce “default theme”, I can’t wait to take a look at, once it will be released in about a month together with WooCommerce 10.
Fireside chat with Mary Hubbard and Matt Mullenweg
After many sponsors had their raffles – I did not win anything, but one of my colleagues won a Braille Lego set – I went to the final session. The first half was some talk between Mary – which I haven’t had met before – and Matt, in which Mary asked some questions. The second half was with questions from the audience, and both Mary and Matt allowed for some 15 minutes extra to answers all of them.
Closing Remarks
Always a special part: we could thank the amazing organizing team and all the volunteers for their work. I’ve tried to capture the moment, but the lens of my phone was now wide enough to get all in one shot. This shows, how many people help to make this week an event for all of us!
Then the moment all attendees waited for. The current Global Leads say goodbye and the new team is coming on stage to announce where WordCamp Europe is going to next year. I had a strong guess and was right. But see for yourself:
Yes, there was also an After Party, as every year. I took the chance to speak to some people I haven’t had the time to talk to, yet. And still there were some attendees I have not spoken to this week. Even if this year was smaller with “only” 1723 attendees, there is just not enough time to catch up with everyone. But I hope that I will see many of them next year in Poland!
Conclusion
I’ve been to all WordCamp Europe editions, and being in Basel I’ve realized, that there have been as many WordCamp Europe event (including the online ones) since Berlin, than before Berlin. I can’t believe it’s been that long ago.
Basel was special in its own kind. The weather might have been the rainiest for a WCEU, but the city was just amazing, and I’m glad I was able to attend again. But Basel was also the most expensive one. Not only for the organizing team, who had to work around a very tight budget. With only 50€ per ticket, they still managed to find enough sponsors to dev lier a great overall experience. But unfortunately, for some many community members, Basel was just too expensive to take the journey this year. I believe that Poland will allow many more attendees to return, which will also result in a much more diverse group of attendees, not just the ones who can afford it or are sponsored to attended by their employers. I’ll hopefully see many of you next June, then!
For a small project, I’ve implemented my first Block Theme (that I finished) using the Create Block Theme plugin. In the PDF with the design, there was a “round button”, which made me wonder on how I would implement it.
It seemed easy at first. Just add a button, write some text inside and set the border-radius to 50%, to make it round. The problem is: that will only work if the button has exactly the same height and width. But since you don’t know in advance what text you would use in the button, and only the width increases, the button will have an oval shape:
That doesn’t work. But how can we get the button perfectly round? We need to set the aspect-ratio for it to 1. While registering custom aspect ratios was introduced in WordPress 6.6, we cannot use it for any block. It’s currently only available for the Image, Feature Image and Cover block. How can we achieve it? That’s where Block Style Variation come into play.
What is a Block Style Variation?
As many of you know, one of the hardest things in tech is naming things, and there are many things in the “Gutenberg project” with similar names, making it all confusing. A Block Style Variation – sometimes referred to as only Block Style – is a feature that lets you create an alternative style for a block. When we think of the core/button block, we usually have the “Fill” and the “Outline” styles. The core/table block has the styles “Default” and “Striped”. WordPress Core comes with many of these block styles. But you can create your own custom ones.
Creating your own Block Style Variation
On the documentation page about Block Style Variations, you can (currently) find two different methods to register a custom block style: PHP and JavaScript. Those of you who wrote WordPress themes for some years, are probably (still) quite familiar with PHP, so let’s take a look at how to do it with PHP.
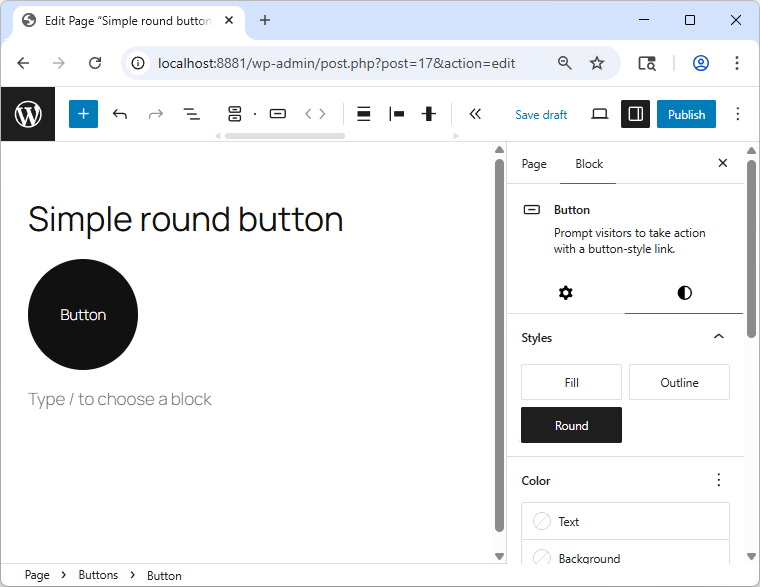
Register a Block Style with PHP
We want to have a round button, and all we have to do, is adding some PHP to our functions.php file like this:
With this code in place, we can now select the new block style from the “Style” settings in the “Block” sidebar:
Now this looks nice! And it was not really a lot of code we had to use. But it doesn’t feel right to use PHP to register a block style, when we want to create a Block Theme. So how can we do it instead? Well, we could use JavaScript, and you can find an example for that in the documentation, but I like this solution even less.
When you scroll down that page, you will find this notice:
It is not currently possible to customize your custom-registered block styles via theme.json. You can only style those registered by core WordPress at the moment.
This is really unfortunate. But it’s also not true. I’ve found a solution to register a block style and also style it using the theme.json file.
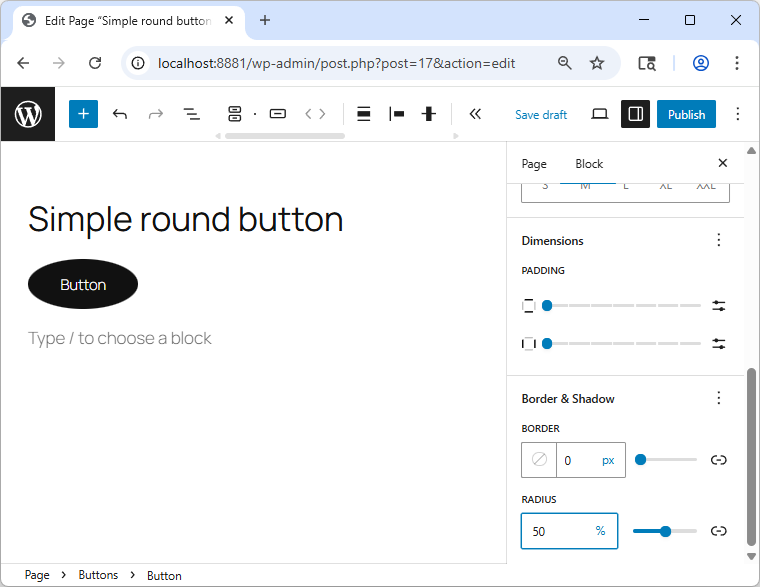
Register and customize styles for a Block Style using JSON
The feature to use custom block styles was also introduced in WordPress 6.6, and in order to use it, you need to create a new file in the styles/blocks folder of your theme. So we could create a file styles/blocks/round.json with this content:
This is really all we have to do. We can give this file any name. And we don’t have to “load” it, this is done automatically by WordPress. You should use "version: 3" here and also set the $schema to use at least “6.8” or higher (or trunk, for the latest version).
Overwriting custom Block Styles
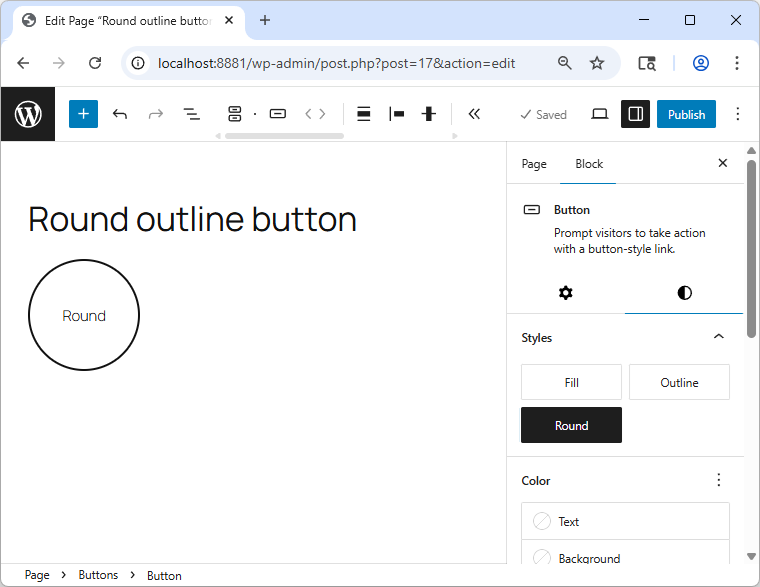
Even though the statement says that you can’t style your custom block styles using the theme.json file, you can do it. I’ve tested it successfully in a local WordPress 6.8 installation. You could do it like this:
This would overwrite the border and colors and give us a “round outline button” that would look like this:
All of this was possible by only editing some JSON files. No need to write any “real code” in PHP or JavaScript.
Caveats
Even though we were able to create a round button without any “custom code”, the result is not perfect. We have used the dimensions.aspectRatio property for the button, but since it is not yet supported for a core/button block, we won’t be able to see and edit it in the global block styles for the theme.
Conclusion
Adding a custom block style to an existing core block can make it easier for content editors to create consistent layouts. If you want to avoid writing “real code”, you can add them using only JSON files.
I really hope that the aspectRatio and other options will be made available to other blocks as well, and also that we are able to create block styles using only the Site Editor in the future. There is already a ticket about this, but I understand that this is quite a large feature.
One of the questions I hear a lot in different settings is this: “Which plugin do you use on every site?”. I usually don’t have an answer for that, since in my opinion, there is no “mandatory plugin”. But one plugin I do use almost always, at least while developing a site, is the Query Monitor plugin. It helps me a lot in finding issues with the site. I even have it active on some production sites.
Since I work on some projects hosted on WordPress VIP, I was asked to take some VIP trainings. One of these is around all the ways in which you can debug a website. And sure enough, Query Monitor is also available on WordPress VIP sites.
Extending the Query Monitor plugin
As I’m a frequent user of Query Monitor, I am very familiar with most of its panels. Some of them I use all the time, others rather rarely. But I was not aware that you can “easily” add your own panels with your own debugging data to Query Monitor. Some plugin use this to add information, others have additional “debugging plugins” to add the panels. On the Query Monitor website, you can find a list of those “Add-On plugins”.
The VIP training had an example on how to add some random data to a new panel, and this was so fascinating to me, that I wanted to try it out. I also found a nice use-case for my blog. Since I am using MultilingualPress to translate my blog posts, I thought it would be nice to have a list of translated content on a page or post. So that’s what I am going to demonstrate here.
Collecting the data
The Query Monitor plugin is written using OOP (object-oriented programming) and the first thing we have to implement is a class extending the QM_DataCollector class from Query Monitor, to collect the data we want to display.
The data is stored in a “storage”. We don’t have to implement a custom one, but I wanted to implement a full solution, so I created this implementation of a QM_Data class first:
class QM_Data_MLP_Translations extends QM_Data {
	/**
	 * @var Translation[]
	 */
	public $translations;
}
The MultilingualPress API is using a custom class Translation and we would use an array of these objects in our data class. Now we can implement our QM_DataCollector implementation:
class QM_Collector_MLP_Translations extends QM_DataCollector {

	public $id = 'mlp_translations';

	private $current_locale;

	public function __construct() {
		parent::__construct();
		$this->current_locale = get_locale();
	}

	public function get_storage(): QM_Data {
		return new QM_Data_MLP_Translations();
	}

	public function process(): void {
		$args = TranslationSearchArgs::forContext(
			new WordPressContext()
		)->forSiteId( get_current_blog_id() )->includeBase();

		$translations = resolve( Translations::class )->searchTranslations( $args );

		$this->data->translations = [];
		foreach ( $translations as $translation ) {
			if ( $translation->language()->locale() !== $this->current_locale
				 && $translation->remoteContentId() !== 0 ) {
				$this->data->translations[] = $translation;
			}
		}
	}
}
Every QM_DataCollector needs an $id property, and we use a vendor prefixed mlp_translations value here. In the constructor, we also save the current locale, as for some reasons, it was later changed to the locale from the user profile. In the get_storage() function, we are using the QM_Data object we implemented first.
The most important part is the process() function. This is where we collect the data and add it to our storage. You don’t have to understand the first few lines, as these are the specific functions from MultilingualPress to get a list of all translations to a post or page. The collection of your data might be different, but you will probably end up having a loop to add the data you want to use into $this->data. In my case, I filter out the current translation and also only add those with a remoteContentId, which would give me only “singular content”.
Initializing the Collector
The last step is to initialize the “collector” object in a filter. This is done with the following filter:
function register_qm_collector_mlp_translations( array $collectors ) {
	$collectors['mlp_translations'] = new QM_Collector_MLP_Translations();

	return $collectors;
}

add_filter( 'qm/collectors', 'register_qm_collector_mlp_translations', 10 );
Nothing really fancy here. Now that we have our “collector” with the data we want to display, let’s take a look at how we can do that.
Adding our data to Query Monitor
Query Monitor has several panels, and you can either add your own panel, or you add data to an existing one as a “child panel”. I went with the second approach, as it seemed to me more logical to add my data to the “Languages” panel. This is the complete code (with comments removed):
Let me explain some of the important functions. In the constructor, we are using a filter to call our panel_menu() function, that adds the panel. Here you can see that I add the data to the children of qm-languages. I also get the collected data here to be able to add the number of translations to the panel title.
In the output() function, we generate the output. We first check if data is available. If not, we just output a notice. You may have recognized all these $this->before_*_output() and $this->after_*_out() functions. They are inherited from the parent class QM_Output_Html and saves us from writing some HTML markup ourselves.
The most important output is happening in the output_translation_table() function. This is a helper function that I have added. You might not need to have such a function, and you can also rename it so it best fits your use-case. I just named it similar to other functions in Query Monitor itself.
After generating the <thead> with some table column names, we print out the data for the translations. We are using some methods of the Translation objects from MultilingualPress to get the site ID, post ID, post title and permalink for the translated content.
Initializing the output class
Just as with the collector class, we have to initialize our HTML output class. We use another filter here:
To avoid loading the classes if Query Monitor was disabled, we first check the QM_DISABLED constant. We then require or files with the three classes, which contain the filters to initialize them. In the implementation, I wanted to stick as closely to the Query Monitor code base, as possible. I would usually not have filters to initialize classes in the same file as the classes themselves.
The result
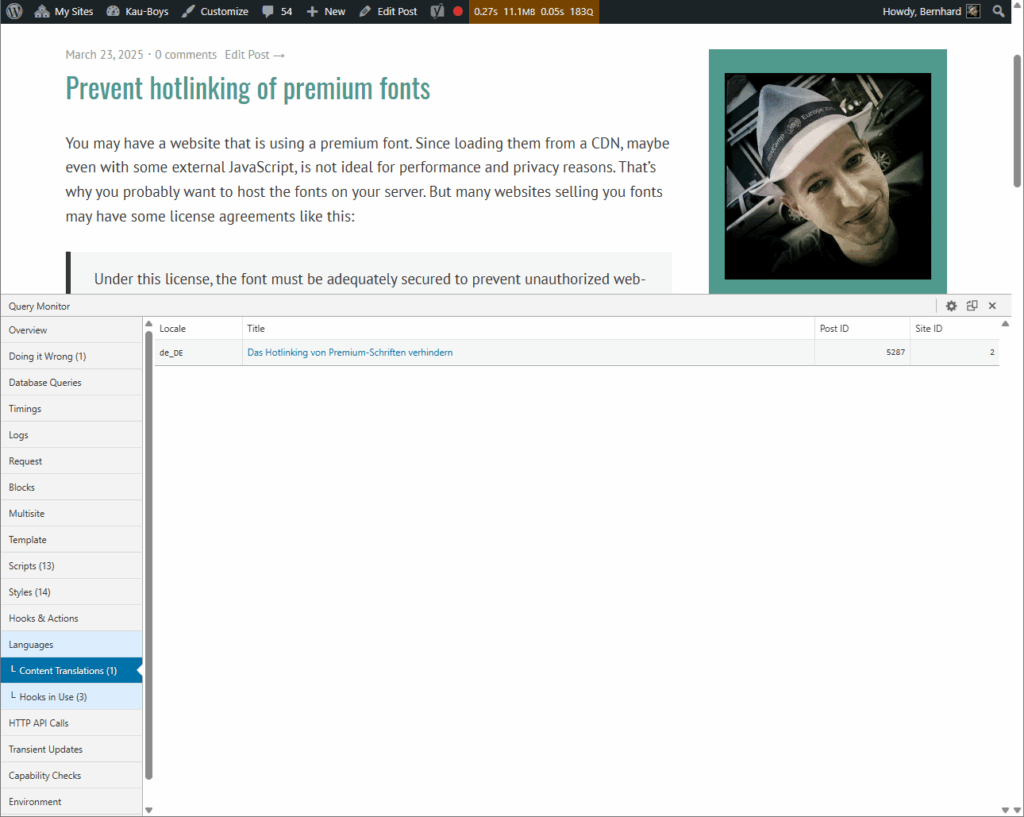
After doing all that, you probably all want to see the result of our work, right? Then let’s install that plugin real quick on my blog and show you the output for my last blog post:
Pretty cool, right? Since my blog has only two languages, and it only shows one translation, this might not be super useful. But we could think about other information to show in this panel. Maybe the translation of all taxonomies used in the blog post. Or some important settings from MultilingualPress.
Conclusion
Adding a custom panel to Query Monitor can help you debug important information more easily. You might have a very different use-case for a custom Query Monitor panel. Or maybe you have even used it yourself in the past. Then please share a link to your solution, if it’s public.
If you have MultilingualPress running on your website as well, or just want to see the full code of this example, you can find it on Github where you can also download it as a plugin ZIP and test it.
You may have a website that is using a premium font. Since loading them from a CDN, maybe even with some external JavaScript, is not ideal for performance and privacy reasons. That’s why you probably want to host the fonts on your server. But many websites selling you fonts may have some license agreements like this:
Under this license, the font must be adequately secured to prevent unauthorized websites, beyond the licensee’s direct control, from accessing the font software for content display, including hotlinking or direct access via web server integration
Now, how can we do that? This highly depends on the web server and infrastructure you are using. Let’s take a look at some different apporaches.
Using a web application firewall like the Cloudflare WAF
In a project I had this need, it was not possible to change the server configuration. But the whole website was behind Cloudflare. In Cloudflare, there is a special Hotlinking Protection, but it can only prevent a few image types from being hotlinked.
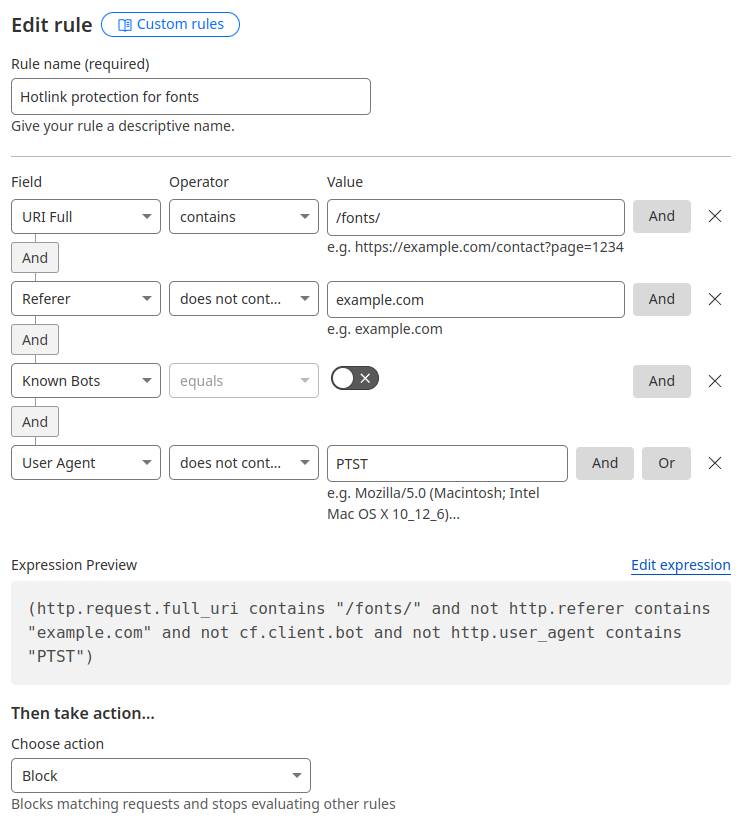
After some tries, I came up with a rule that worked for web fonts as well. You can configure it with in the UI of the Cloudflare under “Security -> WAF”:
You can also alternatively use the “Edit expression” link and paste the following code into it:
(http.request.full_uri contains "/fonts/" and not http.referer contains "example.com" and not cf.client.bot and not http.user_agent contains "PTST")
This rule prevent hotlinking of any path that contains the folder /fonts/. This might be a bit too strict, since it could also prevent other (free) fonts or those stored in plugins. You might instead want to use a more specific folder, like wp-content/themes/your-theme-slug/assets/fonts/ in the “URI Full” field.
The other field you have to adjust is the “Referer” field. This is where you use your own domain name. It’s important to set it to “does not contain” (or similar), since we want to block requests, that “do not” come from your domain.
The “Known Bots” and “User Agent does not contain PTST” does prevent the rule from being used when your site is accessed by search engines or the performance tool webpagetest.org, so it does not interfere page visits by these services.
Finally, in the “Then take action…” we choose the “Block” action, which prevents the loading of the hotlinked font.
Using an nginx configuration
When you are using nginx as your web server, you can also block hotlinking to your premium fonts, using the ngx_http_referer_module, by adding the following location to your configuration:
This will also block any hotlinking from other domains. Consult the Apache documentation for other RewriteCond values.
Limitations
Both, the nginx and the Apache examples, do not handle search engine bots and performance tools. It would be possible to not block them, but this would be more complex to set up.
You should also be aware that all these solutions are not “secure”, as they don’t really prevent hotlinking. If someone wants to use premium fonts stored on your server for their websites, they could write “a proxy” and manipulate the HTTP_REFERER header so it looks like the requests are coming from your server. But I’d say that one of the measures shown in this blog post should be “adequately secure”, as stated in the license agreement. But since I can’t give you any legal advice, better ask back to the font vendor, if your measures are good enough for them.
Conclusion
Using a nice premium font can make your website stand out. Hosting them on your own server makes loading them faster and reduces privacy risks. But always read the license agreement, if you find some requirements like the prevention of hotlinking. Otherwise, you could get in real trouble.
In a project I’m working on, I made an interesting discovery this week. The website had only two comments – it’s a WooCommerce shop, so comments are not really important. Those two comment however were made on an attachment page. The page had the title “contact-2” and was a header image. Most probably, someone searched for the “contact” page of the website and found this page with the comment form, thinking that this is the contact form.
What is an attachment page?
For those of you, who never came across an attachment page, let me quickly explain, what they are. Some of you might know, that every item you upload into the media library, a database entry is created. Those entries are in the wp_posts table with the post type attachment. So every media item it “a post”. And since the attachment post type is set to public, every media item has an attachment page.
In the case mentioned above, there was a file with the name “contact.jpg” uploaded. Since there was already a regular page with the title “contact”, WordPress appended the “-2” suffix. I have a blog post about this suffix and how to remove it. But what does that mean? If you access a URL like https://example.com/contact-2, you would get a page, that may be using the singular.php template of your theme, unless the theme has a better template for attachments.
On this page, you would see the media item, in the case of an image, you would see the full size. You can see an attachment page on the demo site for the Twenty Nineteen theme. This URL is using the attachment_id parameter, using the post ID of the attachment (media item). You could also use the p parameter, which then redirects. But depending on your permalink settings, you might also see a “nice URL” like the “contact-2” mentioned earlier.
Why you (don’t) want to have an attachment page
If you have a media heavy blog, and you want to allow commenting your media item, the attachment page might make sense. But for most pages, they would just “blow up” the pages of your website, and they can be in conflict with some “normal pages”.
Those attachment pages are also visible to search engines, and since they only use the file name as the title, you might end up with a page getting (more) traffic to those pages, and not to the normal pages you want to have traffic to. Fortunately, the attachment pages are not showing up in the sitemaps.
How to remove the attachment pages?
You can’t really “remove” them. You can make them “not public”, but there is a simpler way. If you set up a new WordPress site starting with WordPress 6.4, you can stop reading this blog post, since you already have a solution.
I usually use the WP-CLI for such tasks. If you also use it, you can run the following command:
wp option set wp_attachment_pages_enabled 0
A value of 0 for the wp_attachment_pages_enabled option disables the attachment pages, and the redirect_canonical() function would then redirect to the media file.
Using the option.php page
If you don’t use the WP-CLI or you can’t use it, you can also use a “hidden feature” in the WordPress Dashboard. Navigate to wp-admin/options.php, where you can view and edit options. Here you search for the option name, change the value from 1 to 0 and save the options “Save Changes” button at the end of the options page.
Using a SEO plugin
Some SEO also have an option to redirect the attachment pages (or deactivate them differently). I use Yoast SEO on most of my pages, and here you would find it as “Yoast SEO > Settings > Advanced > Media pages”. In this section, you toggle the “Enable media pages” off. If you instead want to use the pages, you can set some other settings here for attachment pages.
Conclusion
It’s easy to forget that attachment pages exist in WordPress. There were probably good reasons to have them in the past, but on a typical website, they are often not something you want to have traffic to. Fortunately, you can “disable” them without additional plugins now.
After writing a blog post in the 24 days before Christmas, I took the month of January off to get some new energy and collect some more and other topics to write about. Since I’m currently preparing for an accessibility certification, I want to have some blog posts around these topics. Today, you will get the first one. But I might blog about different topics in between.
Setting a menu label in a Block Theme
When you have a website with only one navigation using the <nav> tag, you are probably safe. Still, it can make sense to have a (good) label for your main navigation menu. But as soon as you have two menus, you must add labels.
Many screen readers have the option to jump to “landmarks” on your site, so a visitor can use this to easily find the navigation menu(s) on your page. But they will usually only here how many items are in each menu, not what the menu is about.
The default navigation menu in Twenty Twenty-Five
When you start a new WordPress project using the default theme Twenty Twenty-Five, your navigation menu will only have the “Sample Page” as an entry, and it would have an aria-label attribute, but it is empty (all other attribute values are replaced with ..., since their content is not important in this code snippet):
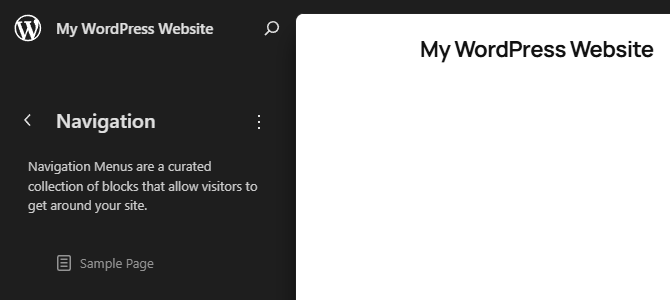
The navigation menu has a name, though. It is simply “Navigation”. When you navigate to “Appearance > Editor > Navigation”, you should see something like this:
When you click on the three dots next to the title, you can easily “Rename” the existing navigation. Let’s rename it to “Main navigation”. If we now refresh the frontend, we see … no change. Even after changing the title, the aria-label is empty.
Solution: change the title by duplicating the menu
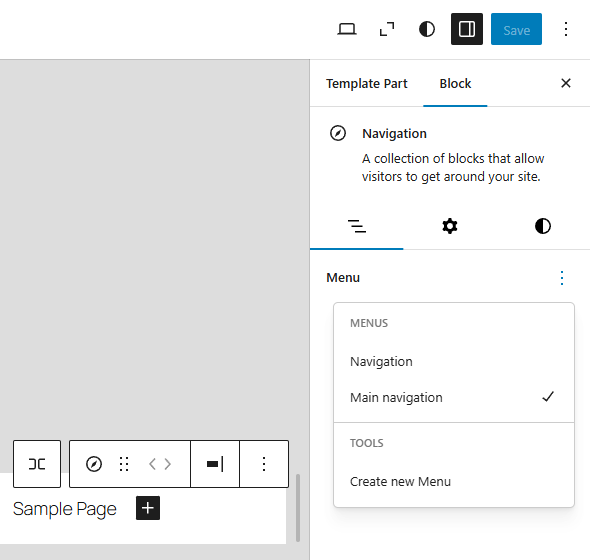
I don’t really know why the change of the title does not add any aria-label, but I found a workaround. Instead of using “Rename”, you can use “Duplicate”. This will add a “(Copy)” suffix to the duplicated menu. Now you only have to use this new navigation menu at the position you want to have it. For example, you navigate to “Appearance > Editor > Patterns > Header” then, select the header and click on the navigation block. In the Block settings, you click on the three dots right of “Menu” and then select the new menu you have duplicated and renamed:
If we now save the header with this new menu, and refresh the frontend, we finally have our aria-label:
In the dropdown in the screenshot above, you can also see the “Create new Menu” option. If you create a new navigation here, it would get a name like “Navigation 2”. This would automatically be used as the label. But you would have to back to the Site Editor to change the label. It would be nice, if that would also be possible here.
Adding a label to a Classic Theme
If you are still using a Classic Theme, you have to manage the label differently. Even though WordPress supports labels since version 5.5, many themes still don’t use them. Or at least not with the new parameter. This is how the label is added in Twenty Twenty:
Adding a label to each navigation menu can make a huge difference for the accessibility of your website. When you use a Block Theme, you can do all of that without touching any code directly in the Site Editor. And since I’ve showed you, that the automatic navigation menu names are not really ideal, you might want to check the labels of your website and give them a better label.